Summary: The Regional Greenhouse Gas Initiative, including the six New England states and four Mid-Atlantic states , is the oldest greenhouse gas reduction regime in the U. S, using a cap-and-trade mechanism. Greenhouse gases are responsible for global warming occurring in recent decades. It is also the most modest, affecting only emissions originating from electric power plants. Since it began operating in 2009, it has collected large sums of money and has led to the creation of many new jobs and businesses. While this modest beginning is praiseworthy, it is important to strive toward major, significant reductions in greenhouse gases, so that the increased level of greenhouse gases in the atmosphere can be stabilized.
Introduction: In recent years three regional initiatives have been set in place in the U. S. The Western Climate Initiative, formalized in February 2007; the Midwestern Greenhouse Gas Reduction Accord, set in place in November 2007; and the Regional Greenhouse Gas Initiative (RGGI), established in July 2007. RGGI is discussed in this post. The three regional accords encompass 23 states in the U. S.
The American states participating in these three agreements, and their greenhouse gas emissions, are shown in the following map:
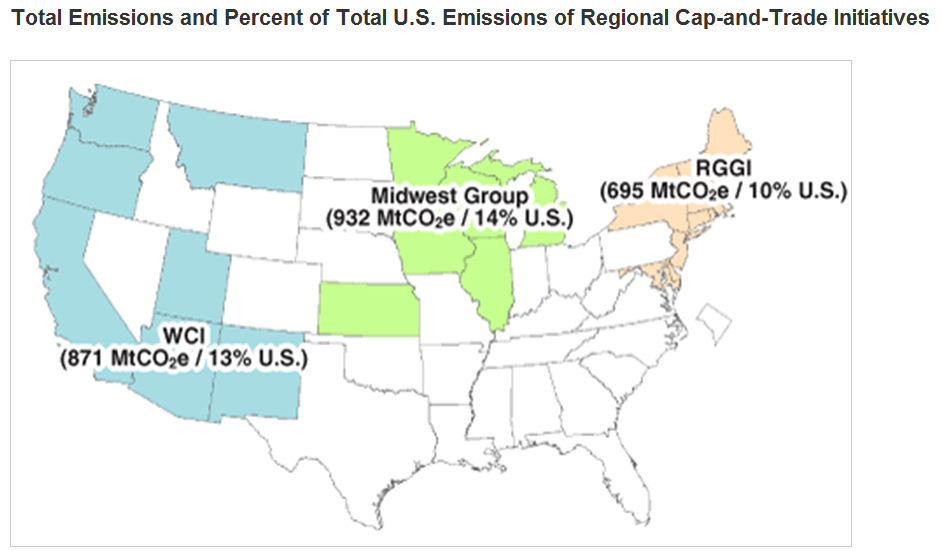
Map displaying the three regional greenhouse gas emission reduction programs in the U. S. U. S.
Source: World Resources Institute (http://www.wri.org/stories/2007/11/midwest-greenhouse-gas-accord-numbers)
RGGI incorporates the ten states of Maine New Hampshire Vermont Connecticut New York , New Jersey Delaware Maryland New York Midwest power plants that cause acid rain, and identified under the U. S. Clean Air Act.
RGGI was formalized in July 2007 by the establishment of the nonprofit corporation RGGI, Inc., whose role is to coordinate and oversee the administration of the Initiative. As with the other two accords, it is up to the individual states to enact the enabling laws for operation of the Initiative in the respective states. A Memorandum of Understanding (MOU) among the member states was initially issued in December 2005 by seven of the ten states. The remaining three joined by early 2007. As such, RGGI is the first of the three regional greenhouse gas accords currently operating in the U. S.
The MOU recognizes that global warming due to man-made greenhouse gases is occurring, and that the resulting increase in average global temperature has negative effects on the states involved, including more severe droughts and floods, changes in forest composition, and increasingly damaging storm surges along the coast. It also recognizes that reducing the need for imported fossil fuels will enhance energy security and will lead to development of new industries related to renewable and sustainable energy sources.
Contrary to the WCI and MGGRA which cover all major activities that produce greenhouse gases, the RGGI accord agreed on controls only for fossil fuels used in electric power generation, affecting facilities with greater than 25 megawatts (MW) generating capacity. It covers 209 facilities across the region. The member states agreed to create a CO2 Budget Trading Program within the region, with the goal of stabilizing and then reducing the overall emissions from this source. Each state’s base emission amount was established at the outset, totaling 188 million tons of CO2, and is to remain fixed at that level from 2009 through 2014. The emissions limits are implemented by selling emission allowances, where 1 allowance covers 1 ton of CO2 emissions. Starting in 2015, the allowances for each state are to be reduced by 2.5% per year, so that by 2018 the emissions will be 10% below the starting level. The Trading Program is in fact a cap-and-trade regime, in which the allowances are tradable in an auction market. The auctions occur quarterly. They ensure fair pricing of the right to emit greenhouse gases on an open market available to all parties. RGGI estimates that the auction price increases the cost of electricity to the consumer by only 0.4% to 1%.
The MOU also allows for offsets that serve as substitutes for actual reductions of CO2 emissions from a particular source. Instead of achieving reductions in emissions at an emitting site, the source may use a limited part of its CO2 allowances to purchase offsets from remote facilities that accomplish reductions of emissions or new increases in CO2 removal from activities such as afforestation. Initially the offset facilities must be within the region covered by the Initiative, but can be expanded to be anywhere in North America . Allowances granted are biased to favor using offsets within the region.
Each RGGI state uses two thirds of the proceeds from the sale of allowances to promote activities that contribute to further reduction in greenhouse gas emissions. These include subsidizing energy conservation activities and promoting renewable energy industries.
The RGGI model presents itself as serving as an example for a) a functioning cap-and-trade regime, b) a program that will reduce greenhouse gas emissions from fossil fuels, and c) identifying and promoting new ventures developing renewable energy sources and conservation. As the oldest regional accord in the U. S.
Political Environment and Practical Results. RGGI is the first regional initiative in the U. S.
These considerations, and others, have led to the failure to impose greenhouse gas restrictions at the federal level in the U. S. It is reported, however, that as of December 2010 RGGI has been a success in most of the states covered by RGGI. Nine auctions have been held, garnering $729 million. The auctions have proceeded without problems, contrary to the early experiences of the European Union’s Emission Trading Scheme. In New York
Unfortunately, positive revenue balances in government accounts are always susceptible to attack. In the present economic environment in which most U. S. New Jersey Connecticut
RGGI Leads the Way toward Stabilizing the World’s Atmospheric CO2 “Bathtub”. The modest reductions in the emissions of greenhouse gases under RGGI are first steps toward achieving a leveling off of the atmospheric CO2 concentration. Much more needs to be done, however. The global atmosphere, and its CO2 component, can be thought of as a "bathtub", having a "faucet" that adds new CO2, and a "drain" that removes CO2. The present amount of CO2, about 390 parts per million (ppm), is already higher than in the past several thousand years, and the highest since the start of the industrial revolution. The”faucet”, including increased burning of fossil fuels worldwide, is adding about 2 ppm CO2 each year; the “bathtub” is getting fuller. (There are fewer balancing activities that “drain” CO2 and other greenhouse gases from the atmospheric “bathtub”.) The stronger greenhouse effect from this CO2 leads to higher overall, long-term, global temperatures, which are also higher than in the past.
Thus it is imperative not merely to reduce the rate of adding new greenhouse gases to the atmospheric “bathtub”, but rather to achieve zero world-wide emissions as soon as practically possible.
References:
RGGI Fact Sheet http://www.rggi.org/docs/RGGI_Fact_Sheet.pdf.
RGGI CO2 Allowance Tracking System http://www.rggi.org/docs/RGGI_COATS_in_Brief.pdf
© 2011 Henry Auer


