See the Tabbed Pages for links to video tutorials, and a linked list of post titles grouped by topic.

This blog is expressly directed to readers who do not have strong training or backgrounds in science, with the intent of helping them grasp the underpinnings of this important issue. I'm going to present an ongoing series of posts that will develop various aspects of the science of global warming, its causes and possible methods for minimizing its advance and overcoming at least partially its detrimental effects.

Each post will begin with a capsule summary. It will then proceed with captioned sections to amplify and justify the statements and conclusions of the summary. I'll present images and tables where helpful to develop a point, since "a picture is worth a thousand words".

Showing posts with label Antarctic. Show all posts

Tuesday, May 21, 2013

Modern CO2 Levels Far Exceed Any in the Past 800,000 Years

Summary.  The atmospheric CO2 concentration has just exceeded 400 ppm, and is continuing to grow.  More importantly, contemporary CO2 levels since the industrial revolution have always exceeded the highest levels found in the geological record for 800,000 years.  Furthermore, the rate of growth of atmospheric CO2 levels is itself accelerating.  The excess CO2 originates from burning fossil fuels.  Changes in CO2 levels in the geological record, while considerable, occur on a scale roughly 60 times slower than the contemporary changes.

 
Introduction. Contemporary climate scientists have been monitoring the atmospheric concentration of carbon dioxide (CO2), a major greenhouse gas, for many decades.  Prior to that, paleoclimate scientists, those who seek to reconstruct ancient climates using the geological record, have examined CO2 contained in ice cores drilled in major glaciers and ice fields, among other modalities for estimating ancient CO2 amounts.  The present measured level of atmospheric CO2 exceeded 400 parts per million (ppm; volumes of CO2 contained in 1 million volumes of air) for the first time last week.  The popular news media picked up on this landmark event as an indicator of a worsening trend in global warming; in fact this situation has been a dire one for some time without the human esthetic preference for a round “hundreds” number.

This post presents the contemporary record of atmospheric CO2 and places it in the context of an extended paleoclimate record.  The present atmospheric CO2 content and trends are indeed unprecedented for the past 800,000 years.

The Contemporary CO2 Record.  Charles Keeling began direct measurements of atmospheric CO2 levels in 1958 atop the Hawaiian volcano Mauna Loa, at 13,678 ft (4,169 m), in 1958.  Those measurements continue to the present day.  The site was chosen to avoid major influences of human activity in more civilized or urban settings; it is isolated in a large ocean, and not affected by large populations.  Generally, measurements taken at this location are thought accurately to reflect CO2 emanating from at least the entire Northern Hemisphere.  The Mauna Loa record up through 2012 is shown in the following graphic. 


On May 9 the CO2 concentration was recorded as 400.15 ppm.
Source: Scripps Institution of Oceanography presenting data gathered at the U. S. National Oceanographic and Atmospheric Administration facility on the summit of Mauna Loa, Hawaii.  Accessed May 20, 2013.   http://keelingcurve.ucsd.edu/.
 
Two features of the graphic are important.  It shows that atmospheric CO2 has been increasing, from about 317 ppm in 1958, to just less than 400 ppm in 2012.  It surpassed 400 ppm on May 9, 2013 (accessed May 21, 2013).  There is no evidence that the accumulation of atmospheric CO2 is slowing down.  Second, the rate of accumulation of atmospheric CO2 is also increasing.  A quick glance at the graphic shows that an averaged line for CO2 accumulation is getting steeper.   Indeed, the rate of increase of CO2 concentration has grown from about 0.7 ppm per year in the late 1950s to 2.1 ppm per year during the last 10 years.  
 
(The measurements are so accurate and sensitive that they reflect seasonal fluctuations seen as annual waves, higher in the northern hemisphere winter, when green plants are quiescent and humans produce more CO when heating their homes, and lower in summer, when green plants remove CO2 from the air and generally less fuel is used for space conditioning.)

The “Recent” Historical Record.  Now we will examine the CO2 dating from the year 1700 CE (common era).  CO2 concentrations for the atmosphere from times before the Mauna Loa measurements began are obtained from glacial ice cores.  As snow and ice fall onto glaciers of the Arctic and Antarctica small bubbles of air are entrapped by the solidifying ice.  Eventually the ice is solid enough that its entrapped air bubbles cannot equilibrate with the ambient atmosphere any more; the bubbles then entrap air representative of the time at which the precipitation solidified.  These air bubbles are harvested by climate scientists in time sequence by drilling ice cores, about 5 in (12.5 cm) across and capturing the bubbles as they are released in a carefully controlled laboratory environment.  The cores are layered year by year, so it is easy to enumerate the age of the bubbles.
 
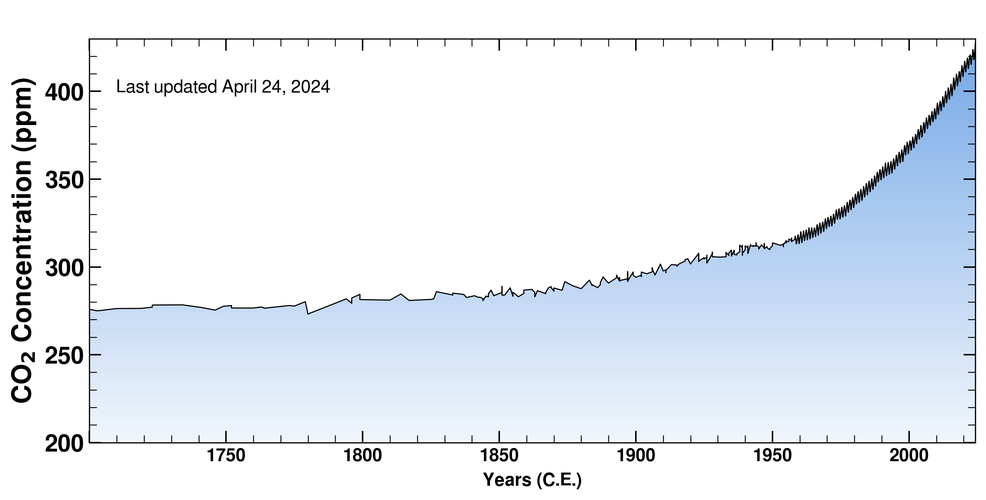
The following graphic shows the atmospheric CO2 concentration from 1700-2012 CE.  Ice core data were used for 1700-1958, and the Mauna Loa atmospheric record, as shown above, for 1958 to the present.
 
CO2 concentrations for the period prior to and through the Industrial Revolution, from 1700-2012 CE.  Data from ice cores for 1700-1958, and from the Mauna Loa record after 1958.  This image is the same as presented in the last graphic below, in Panel B). Source: Scripps Institution of Oceanography; http://bluemoon.ucsd.edu/co2_400/co2_800k_zoom.png
 
 
The atmospheric CO2 concentration is essentially unchanged from 1700 to 1800, showing that additions to the atmosphere from, for example, decay of vegetation and human use of firewood, was balanced by photosynthetic uptake and other processes that deplete CO2.  But as the industrial revolution took hold after 1800, and expanded radically in the 20th and 21st centuries, the concentration grows higher and higher, and at more and more rapid rates, as time passes.  The emission of CO2 into the atmosphere and its removal are no longer in equilibrium because of the additional burden of CO2 emitted arising from burning fossil fuels to power the industrial revolution.  This is more than a simple surmise or hypothesis.  A particular physical property of the CO2 in the atmosphere changes with time along a path that follows essentially the exact same curve with time.  This property is one that shows conclusively and without question that the added CO2 originates from fossil fuels.  It is concluded that human activity, burning fossil fuels for energy that powers industrialization around the world, is the cause of the sharply rising CO2 concentration in the last 160 years.
 
The Paleoclimate CO2 Record.  Ice cores from Antarctica, extending as deep as about 9,840 ft (3000 m) provide CO2 concentrations going back 800,000 years.  Results are shown in the graphic below.
 
 Combined results from ice cores at several locations extending from 800,000 years before the present at the left, in blue and aqua, up to the present at the right.  The orange and red points at the right are data for the Industrial Revolution, such as presented in the previous graphic.  kyBCE, thousands of years before the Common Era.
Source: U. S. National Oceanographic and Atmospheric Administration (accessed May 21, 2013).
 
 
This dramatic image shows that atmospheric CO2 levels oscillated over geological time scales of several hundreds of thousands of years, with many increases and decreases.  The changes, when compressed to this time scale appear to be abrupt and sudden (discussed further below).  Nevertheless, the highest concentration over this time scale is usually under about 280 ppm, and attained about 300 ppm on one excursion.  High concentrations of CO2 would correspond with warmer climates, reflecting the greenhouse effect of the gas.  There are, furthermore, several periods below 200 ppm.
 
It is highly significant that practically the entire record for the time of the industrial revolution has higher CO2 concentrations than found throughout the 800,000 year interval illustrated above.  Thus, although popular interest focused last week on the fact that concentrations exceeded the round number of 400 ppm, it is far more significant that CO2 concentrations have been above levels found in the 800,000-year geological record for the entire time since the industrial revolution began.  Humanity’s burning of fossil fuels has disrupted the natural CO2 cycle that has existed geologically for at least 800,000 years in unprecedented quantities and with unprecedented speed.
 
Contemporary CO2 emissions vastly exceed geological emission rates.  The previous graphic includes many periods in the geological record that appear to the eye of the casual observer to show rapid emission (or depletion) rates.  Visual images can be very powerful in this regard.  But it is critical to scale the sharp changes to the very long time scales shown on the horizontal axis above.
 
This writer has consulted the raw data table for the points shown in the graphic above, and selected one period of seemingly abrupt change in CO2 concentration, in the period spanning 128,609 and 135,603 years BP.  The results are shown in Panel A) of the graphic below. 
 
A) CO2 concentrations obtained from Antarctic ice cores for the interval 135603-128609 years before the present (i.e., the time axis runs left-to-right from more ancient to more recent).  Each vertical line marks a 500-year interval.  Data extracted from the 800,000 year record in Luthi et al., Nature 2008, Vol. 453|doi:10.1038/nature06949. 
B) CO2 concentrations for the period prior to and through the Industrial Revolution, from 1700-2012 CE, compressed by this author so that the 300 year interval occupies about the same horizontal distance as it would if it were displayed in panel A) (the time axis runs left-to-right from 1700 to 2012).  This image is the same as presented in the second graphic, above. Source: Scripps Institution of Oceanography; http://bluemoon.ucsd.edu/co2_400/co2_800k_zoom.png.

 
It is seen that in fact what appears to be an abrupt change in the compressed geological image further above is in fact quite extended.  The CO2 concentration rises from 198 to 287 ppm, or 89 ppm, over a very extended span of 6,994 years, or by 0.013 ppm/yr.

In contrast, the change in CO2 concentration over the industrial revolution is shown in Panel B) in the graphic above.  This is in fact the identical image as shown in the second graphic of this post, covering the 310 years from 1700 to 2012 except that the time scale has been drastically shrunk so that it is about the same time scale as in the geological excerpt of Panel A) (in which each vertical line marks off 500 years).  It is immediately apparent that

a)     the chart in Panel B) starts at a CO2 concentration near the maximum of the geological CO2 record, about 280 ppm and climbs sharply to the 400 ppm level discussed earlier; and

b)     the rate of change of the CO2 concentration in Panel B) is very much steeper than that found in the geological record, averaging to about 0.75 ppm/yr; this is almost 60 times more rapid than the geological change noted above.


Conclusion
 

This post has shown that

a)     geological changes in CO2 levels have practically never exceeded 280 ppm, the level that existed just before humanity embarked on the industrial revolution;

b)     on a time scale relevant to human experience and lifetimes geological changes in CO2 levels change extremely slowly, over periods of many thousands of years;

c)     physical properties of atmospheric CO2 today show unequivocally that the excess CO2 arose in the past century from burning fossil fuels;

d)     virtually the entire increase in contemporary CO2 levels has resulted in concentrations so high that they have never been found in the geological record for 800,000 years;

e)     contemporary CO2 levels continue to increase unabated and at a rate 60 times or greater than in the geological record; and

f)      the rate of growth of contemporary CO2 levels is accelerating.

 
© 2013 Henry Auer

Friday, April 27, 2012

Increasing CO2 Caused Global Temperature Increase as the Last Ice Age Receded

Summary.  Shakun and coworkers (2012) examined atmospheric CO2 concentrations and proxies for local temperature at 80 global locations for the period in which the last ice age was receding.  They found a very strong correlation between increased CO2 levels and global temperature increases, with a lag in temperature change of several hundred years with respect to CO2 changes.  Modeling of the climate during this period showed that changes in CO2 levels alone were sufficient to explain most of the warming of the planet, providing a causative explanation for the warming.
 

The present trends of increasing atmospheric CO2 concentrations and rising long-term average global temperatures are occurring at a rate about 100 times faster than happened during the melting of the glaciers of the last ice age.

Introduction.  The long-term global average temperature (i.e., temperature as measured over the entire surface of the world averaged over time periods of a year or longer) has been increasing in recent decades.  This increasing trend began as the industrial revolution got under way in the 19th century, and has coincided with an increase in the atmospheric concentration of carbon dioxide (CO2) and other greenhouse gases over the same time period.  As a way of lending credence to the causative correlation between atmospheric CO2 levels and the global temperature rise that we are currently experiencing, climate scientists are studying correlations of atmospheric CO2 and global temperatures on geological time scales.  Such work has indeed shown that correlations are found on these long-term times, going back as far as 800,000 years, based on captured contemporaneous air bubbles entrapped in ice cores bored in Antarctic glaciers.
Changes in CO2 and temperature as the Last Ice Age receded.  Jeremy D. Shakun and coworkers (Nature vol. 484, pp. 49-54; 5 April 2012; doi:10.1038/nature10915 ; free abstract available) have reexamined these issues and extended measurements of temperature and CO2 during the disappearance of the last ice age (LIA; 22,000 to 6,500 years before the present).   Their work addressed a number of interrelated questions, both general and specific, that they felt remained unresolved from previous work.  Importantly, as alluded to above, much work had focused on only a few sites in Antarctica, and this had led to ambiguity concerning the sequential occurrence of changes in CO2 and temperature. 


Shakun and coworkers accumulated temperature records previously obtained by others from 80 locations with a wide range of northern and southern latitudes, both oceanic (67) and terrestrial (13), from the end of the LIA.  Each entry had to be dated with acceptable accuracy (200 years resolution).   Of course, humans were not there to measure the temperature; over the last several decades climate scientists have identified and calibrated “proxy” physical or chemical parameters as diagnostic measures of temperature.  In this work, the authors considered proxies derived from seven different parameters.  Whereas the temperature records reflect geographic distinctions across the globe, measurements of atmospheric CO2 need not, since CO2 rapidly disperses uniformly in the atmosphere.  CO2 concentrations at various time points were obtained from ice-entrapped air bubbles from glacial ice cores.  

Increasing CO2 concentrations are correlated with, and occur before, global temperature increases.  The proxy temperature results and the values for the ambient atmospheric CO2 concentrations graphed over a 15,000 year span beginning with the maximal time for the LIA are shown in the graphic below.

Temperature records and CO2 concentrations graphed according to the age in time that the data represent.  Age is plotted along the horizontal axis in thousands of years (kyr) before the present; each minor tic mark represents 1,000 years.  The yellow dots give CO2 concentrations plotted on the yellow vertical line at the left, in parts per million by volume (p.p.m.v.).  The horizontal bars with each dot represent the respective dating uncertainties.  The red line and red shading give the Antarctic temperature proxies with the shading representing the error estimate of the measurement.  The blue line and shading give the proxy global temperature in ºC with the shading representing the error estimate, plotted along the vertical blue line at the left, as the deviation from the average temperature prevailing from 11,500 to 6,500 years ago. 
© Macmillan Publishers Limited.

  
Shakun and coworkers report a very strong statistical correlation between the data for the CO2 concentration and the global proxy temperature results (correlation coefficient = 0.94, on a scale in which 0 indicates lack of any correlation whatsoever and 1.00 represents perfect correlation between two sets of data).  In a more detailed analysis of these data, the authors evaluate that in the Southern Hemisphere, the temperature curve (red line) leads the CO2 concentration curve by 620 years with a standard error of 660 years, in accord with the Antarctic anomaly that these authors identified in the introduction.  However, as readily seen in the graphic, and as further analyzed by the authors, the global temperature curve (blue line) lags the CO2 concentration by 460 years with a standard error of 340 years, and the Northern Hemisphere temperature proxies (not shown above) lag the CO2 concentration by 720 years with a standard error of 330 years.  The authors used detailed modeling of the oceanic Atlantic meridional overturning circulation, a known current prevailing in the Atlantic Ocean, to show that heat from the depths of the ocean contributed non-CO2 driven warming in the Southern Hemisphere, to help explain the Antarctic anomaly.

Thus, considering the overall global temperature results, the authors conclude “the overall correlation and phasing of global temperature and CO2 are consistent with CO2 being an important driver of global warming during deglaciation (melting of the LIA glaciers), with the [hundred-year] scale lag of temperature behind CO2 being consistent with the thermal inertia of the climate system owing to ocean heat uptake and ice melting”.

Increased CO2 levels are largely responsible for increased global temperatures.  In order further to address causality, the authors modeled temperature evolution across the time scale ending the LIA, using a current climate model from the U. S. National Center for Atmospheric Research.  Various factors potentially contributing to the global temperature evolution, such as greenhouse gases including CO2, the global level of solar irradiation, changes in reflectivity of the ice sheets as they melted, and freshwater fluxes into the ocean from the melting, were included in the modeling.  Three model cases are presented in the graphic below, ALL factors, CO2 (including all greenhouse gases) only, and ORB (including solar irradiation only).

Portion of a graphic image taken from Shakun and coworkers showing the time evolution of certain climate parameters.  c, The same CO2 data (yellow dots) as in the first graphic above; d, the same proxy global temperature deviation in ºC (blue line) as in the first graphic above; and e, modeled temperature evolution based on three simulations: ALL (deep violet line) including all factors considered, CO2 (rose-pink line) including only greenhouse gases, and ORB (green line) including only solar irradiation.
© Macmillan Publishers Limited.

The modeled temperature evolution curves in e in the graphic above show that including ALL climate factors (deep violet line) reproduces the observed temperature record based on 80 global observation locations very well, although the amplitude is slightly less (correlation coefficient = 0.97).  Similarly, including only greenhouse gases (CO2 (rose-pink line)) reproduces the ALL model temperature trend exceptionally well (correlation coefficient = 0.98).   In contrast, the ORB model (green line) including only solar irradiation fails to reproduce the observed trend, indicating that this factor, which includes changes in the earth’s orbit around the sun, plays only a “modest role” in causing global temperature change.  In view of these modeled results the authors conclude that “greenhouse gases can explain most of the mean warming [observed] at these 80 sites” around the globe.

Factors contributing to increased CO2 concentrations.  The authors further analyzed earlier data from others and carried out additional modeling themselves to understand the source(s) of the additional CO2 vented into the atmosphere over these many thousands of years.  Detailed modeling of the oceanic Atlantic meridional overturning circulation, responding to the new thermal gradients, the melting of Antarctic sea ice cover, and addition of freshwater to the oceans from melting glaciers (sea level rose by 120 m (390 ft.) over the full time interval considered) as factors contributing to release of CO2 from the ocean depths.
 
Analysis
 
Shakun and coworkers have analyzed experimental results on the time course of atmospheric CO2 concentrations and proxies for global temperature values during the period in which the LIA came to an end.  They showed that these two parameters are highly correlated throughout this time period, and demonstrated unequivocally that global temperatures lagged atmospheric CO2 concentrations by several hundred years throughout this period.  In doing so, they resolved earlier ambiguities in the data apparently due to sampling error, because the earlier results had been based on observations from only a few sites which were not geographically representative of the planet as a whole.

 Using a currently accepted climate model, the authors were able to identify increased greenhouse gases in the atmosphere as being a major factor causing the increase in the global temperature over the thousands of years considered.  This conclusion is highly significant, for it shows that an increase in the atmospheric concentration of CO2 and other greenhouse gases, in and of themselves, can cause an increase in the long-term average global temperature.
 
The changes in temperature and CO2 levels tracked by Shakun and coworkers evolved over 14,000 or more years (each tic mark in their graphics represents 1,000 years).  The CO2 concentration increased from about 190 p.p.m.v. to about 260 p.p.m.v., largely in about 7,000 years of this interval, and the proxy temperature changed by about 3.5ºC (6.3ºF) in this time period. 
 
These are to be contrasted with changes associated with our present increase in the long-term global average temperature.  This has occurred in only the last 150 or so years (or about 100 times faster), as contrasted with many thousands of years; has involved a much larger change in CO2 concentration from about 280 p.p.m.v. at the beginning of the industrial revolution to more than 390 p.p.m.v. presently; and an increase in the global average temperature of about 0.7ºC (1.3ºF). 
 
Shakun and coworkers identified a lag of several hundred years between the time of an increase in CO2 concentration and the increase in the global average temperature.  They mentioned possible factors such as high thermal inertia for absorbing heat by the oceans and the time taken in melting glaciers for this delay.  It is possible that one or both of these factors is also at play today, although other climate-driving factors differ considerably between the end of the LIA and the present trends.  If there be considerable time lags at play at the present time, it may be conjectured that the effects of warming of the planet may require times of one or more centuries to be fully felt.


© 2012 Henry Auer