See the Tabbed Pages for links to video tutorials, and a linked list of post titles grouped by topic.

This blog is expressly directed to readers who do not have strong training or backgrounds in science, with the intent of helping them grasp the underpinnings of this important issue. I'm going to present an ongoing series of posts that will develop various aspects of the science of global warming, its causes and possible methods for minimizing its advance and overcoming at least partially its detrimental effects.

Each post will begin with a capsule summary. It will then proceed with captioned sections to amplify and justify the statements and conclusions of the summary. I'll present images and tables where helpful to develop a point, since "a picture is worth a thousand words".

Showing posts with label SLR. Show all posts

Wednesday, October 13, 2021

What, Again? Sea Level Will Continue Rising for Centuries

Summary: This series of three posts tabulates important findings from the six Assessment Reports (ARs) that the United Nations Intergovernmental Panel on Climate Change (IPCC) has released since 1990.  The first post, “What, Again? Greenhouse Gases Accumulate in the Atmosphere, presents past greenhouse gas (GHG) emission rates and future emission scenarios in the ARs, and presents principles in the ARs to keep accumulated GHG levels to as low a level as possible.

The second post, “What, Again? Global Warming Continues Unabated” summarizes the effects of higher GHGs on past and future projected global temperatures, and reiterates the need conveyed in the ARs to constrain GHG emissions by decarbonizing the energy economy. 

This third post reviews specifically the effects of warming on our water environment: melting ice domains and rising seas, and extremes of precipitation or droughts. The six ARs warn humanity to bring future GHG emissions to near zero; but sea level rise (SLR) is distinguished because melting of ice has passed a threshold of irreversibility: SLR will continue for centuries or longer.

Some may feel this series repeats refrains, looping like broken records; such people may suffer from “climate fatigue”.  Humanity, however, has not responded to the worsening climate documented in the AR series. The critical, dire climate projections summarized in these posts provide powerful incentives finally to take meaningful action at this time.

      *         *         *         *     *

The United Nations Intergovernmental Panel on Climate Change (IPCC) released the first of the three parts of its Sixth Assessment Report (AR6) in August 2021.  ARs have been issued at intervals of 6-7 years since 1990. They document the history of the annual rate of global emissions of the principal GHGs, arising from human activity, and of the total amount of GHGs accumulated in the atmosphere since the industrial revolution began.  Using climate models and a range of scenarios of GHG emission rates from relaxed to stringent they present projections for each scenario of future climate characteristics and effects to the end of this century.  They also discuss general goals (but not specific actions) for limiting future emission rates.

The results and projections presented in ARs 1-6 are broadly consistent with each other across the AR series, but have greater specificity and stronger assessments of likelihood as the series progresses.  All the ARs have stated the need to limit further accumulation of GHGs in the atmosphere in order to minimize the effects of global warming on Earth’s climate.  The faster that emission rates are reduced toward zero, the lower will be the total accumulation of GHGs in the atmosphere.  The cartoon below of two cars traveling down the GHG highway captures this message.
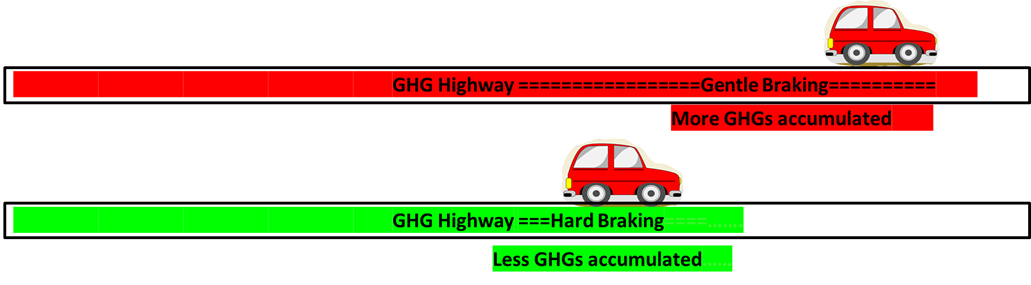
Two cars travelled down the GHG Highway.  Each applied brakes at the same point. On the red trip the brakes were applied gently (a metaphor for moderate GHG mitigation measures), so the car travelled far down the highway before stopping, leading to more GHG emissions accumulating in the atmosphere. (Stopping is a metaphor for ceasing to emit any more GHGs.) On the green trip the brakes were applied hard (a metaphor for intensive, aggressive mitigation measures), so the car traveled only a short distance down the highway before stopping, leading to less accumulated GHG emissions.


The topics selected for this post, tabulated below in the Details section, are Past Sea Level Rise (SLR) and precipitation (column 2), Projected Sea Level Rise and precipitation (column 3), and Recommended Actions (column 4).  Column 2 in the table documents the greater severity (and the greater detail of the data) of melting of glaciers and ice sheets feeding SLR, as well as extreme precipitation events in the later ARs, across the 30 years that the ARs have been issued. Column 3 details projections for future SLR, which are projected to continue for centuries or millennia regardless of mitigation measures that may be applied in the future.  SLR has two contributions (first mentioned in column 3 of the table for the AR2 entry), the expansion of water of the oceans as its temperature rises, and addition of new water to the oceans as glaciers and ice sheets continue to melt. 

The second factor, melting of ice, has reached the stage of being irreversible because the Earth has warmed sufficiently.  A model for melting glaciers or ice sheets is presented in the graphic below:

The melting point of ice is 0°C.  At or below this temperature an ice cube in your refrigerator is stable, and does not melt.  Even a little above this melting point, say at 1°C, the ice cube begins to melt slowly and forms a small puddle as shown.  At 2°C the model shows even more melting, yielding a smaller ice cube and a larger puddle.  Now suppose the refrigerator cools back down to less than 0°C.  The water in the puddles is not magically restored to the remaining mass of the ice cube, but freezes in place.


Extending the above model and its description to nature, the melted water flows away and ultimately drains into the ocean.  The glacier or ice sheet will be restored only if the year-round average temperature is less than 0°C and there is new precipitation as ice or snow.  But enough GHGs have already entered Earth’s atmosphere to warm the air over glaciers and ice sheets, tilting the balance toward net melting, assessed year-round.  This is why climate projections in column 3 of the table below foresee continued SLR for hundreds or thousands of years even if a way is ultimately found to remove accumulated GHGs from the atmosphere. For melting ice sheets and glaciers the “tipping point” has already been reached, and is irreversible on time scales of interest to humans.

The Recommended Actions summarized in column 4 of the table emphasize the need for significant lowering of the rate of emissions of GHGs, coupled with adaptation measures to address aspects of warming that cannot be remedied by mitigation.  This need was presented already in AR1 (1990), saying that immediate 60% reductions in emission rates …would stabilize atmospheric GHGs at the then current level.  In one way or another analogous remedies were presented in the succeeding ARs.  By AR6 (2021) the table’s summary urges substantial emissions reductions over the next few decades to reduce longer term climate risks.  Even so the AR warns with high confidence that warming by 2100 will lead to a high risk of severe, widespread and irreversible impacts, including flooding, droughts and continued SLR.

Whereas the need to reduce emissions was expressed as early as AR1 and extends up to the present in AR6, the strength of climate science underpinning those conclusions has increased dramatically over time.  The capabilities of gathering data and using more powerful computers to analyze them, and to develop more refined, detailed climate models have all increased dramatically.  (Incidentally the Nobel Prize in Physics, awarded October 5, 2021, recognized the development of early climate models.  These have served as the foundation for today’s highly refined models.)

Recent ARs reflect this enhancement in data gathering and climate modeling.  For example  the current first part of AR6 was compiled by 234 climate scientists chosen from the nations of the IPCC.  They reviewed over 14,000 research articles published since AR5.  Drafts of the chapters in AR6 were reviewed by other scientists as well as by national governments and revised accordingly.  We can feel assured that the final text represents scientific and political consensus views.

Conclusion

Column 4, “Recommended Actions” in the table shown in the Details section summarizes the increasing urgency of acting to reduce annual emission rates to near zero as the AR series progresses.

Indeed, actual extreme weather and climate events have become the subjects of frequent current headlines, documenting actual heat waves and droughts, famine, uncontrolled wildfires, intense precipitation events and flooding, and melting of glaciers and ice sheets leading to sea level rise, effects that were only predicted in the early ARs.  Also, by AR6 the science of attribution of extreme climate events has progressed dramatically, and permits ascribing the severity, if not the actual occurrence or not, of events to the effects of human-induced global warming.

Early action such as recommended in earlier ARs could have been taken at moderate levels of effort and expense (“Gentle Braking” in the first graphic above) to avert future, if not yet apparent, climate hazards.  But policymakers around the globe did not seize these opportunities to anywhere near the needed extent.  By 2021 such extreme events are now current, requiring immediate action.  Necessarily these current actions must be far more aggressive, pervasive and costly (“Hard Braking” in the graphic) in order to deal with a warming Earth approaching criticality.  They also require fundamental and comprehensive changes in social and cultural approaches to adapt to the consequences of warming.

Unequivocally we must encourage our political, corporate and civic leaders to embark on bold, comprehensive actions without further delay.

Details

This writer collated the entries in the following table from either the Summary for Policymakers, a “Headline” document or a press release, all issued by the IPCC in conjunction with each AR.  The entries are necessarily selective rather than comprehensive, and have been edited for brevity.

EVALUATIONS OF SEA LEVEL RISE AND PRECIPITATION IN IPCC ASSESSMENT REPORTS


© 2021 Henry Auer

Wednesday, July 9, 2014

Sea Level Rise: Mitigation and Adaptation in the Risky Business Model

Summary.  Sea level rise is caused by expansion of ocean water as the world’s temperature rises, and by net melting of glaciers, ice sheets and ice shelves.  Ice will continue melting as long as the temperature remains above the freezing point.

Sea level rise is already impacting coastal cities in the U. S. and elsewhere.  Regular flooding based on high tide schedules is now happening, for example, in South Florida and Norfolk, VA.

Climate models project future increases in sea level rise in all scenarios examined, for modeling as distant as 300 years from now.  This will clearly damage coastal cities around the world, inflicting major property damage and requiring extensive, expensive renovation projects.

The recent report by the Risky Business Project advocates taking a business-oriented risk assessment approach to global warming.  As applied to the occurrence of sea level rise, risk management involves assessing harms and evaluating investments in both adaptation to continued sea level rise and mitigation of continued global warming.  Such investments would benefit people by protecting them from future harms arising from sea level rise, and by expanding economic activity from new projects undertaken.

 
Introduction.  An earlier post provided a tutorial explaining the sources of global sea level rise (SLR).  One important factor is the increase in volume that the waters of the oceans occupy as their temperature increases.  Since the oceans are contained, the only way to accommodate the increased volume is to expand upward, contributing to SLR.  The second significant contribution comes from melting of ice that originates from a land-based source.  Glaciers and ice sheets, exposed to air on their upper surfaces, melt whenever the air temperature is higher than the melting point of water.  Ice shelves, driven from land-based ice sheets to float on the ocean, melt from below whenever the sea water temperature is above its freezing point. 

The contribution from temperature-caused expansion of the oceans proceeds as long as the ocean temperature continues increasing.  It will cease if the ocean temperature stabilizes.  The contribution from melting reflects the temperature with reference to the melting point of the ice.  This contribution continues to add new liquid water to the oceans as long as the temperature of air, or of the ocean, is above the melting point of the ice.  This process continues undiminished even when the air temperature or the ocean temperature stabilizes at a value higher than the melting point.

Sea level rise is already affecting the U. S.

South Florida.  On March 19, 2014 the (U. S.) PBS NewsHour broadcast a news feature on ocean flooding in South Florida.  The frame below, taken from the broadcast, shows a street in Miami Beach, a municipality built on a barrier island facing the Atlantic Ocean, flooded with ocean water on a sunny day.
 
Source: PBS News Hour March 19, 2014. http://www.pbs.org/newshour/bb/south-florida-rising-sea-levels/

 
Such events have occurred with some regularity in recent years.  The broadcast included an interview with Prof. Hal Wanless, of the University of Miami, who ascribes these events to worsening sea level rise.  It reported that the U. S. Army Corps of Engineers predicts a 3-7 in. (7.6-18 cm) rise in sea level for South Florida by 2030, and 9-24 in. (23-61 cm) by 2060. 

In response, the Miami Beach Public Works Department initially planned a US$200 million remediation program over the next 20 years to fend off flooding and encroachment by the ocean.  Recently the municipality of Miami Beach agreed to double its investment, to US$400 million.  More broadly, a four-county consortium in the area is planning a concerted program to address the expected sea level rise.  The local politicians are grappling with the political pressures opposing the extensive investments needed to prepare for the expected worsening of the problem.

A conference in June 2012 on the effect of global warming  focused on the projected loss of land area in South Florida over the next century due to sea level rise.  It is foreseen that the Florida Key islands would be lost, and that Miami and the surrounding area would be small islands in the encroaching Atlantic Ocean.  The report notes that this area has the most people and property endangered by sea level rise of any in the U. S.

Norfolk, Virginia.  Norfolk is at the confluence of the Atlantic Ocean, Chesapeake Bay and the James River.  It is the site of a major base of the U. S. Navy which is a principal driver of economic activity in the region.  The area has been subjected to continued episodes of tidal flooding along its coastline.  In a report on the PBS Newshour in December 2012 its mayor, Paul Fraim noted that the city is repeatedly flooded at high tides, which is worsening with passing time.  The screen shot below shows a home that been repeatedly flooded in recent times.

 
Still frame from PBS Newshour broadcast on sea level rise affecting Norfolk VA.  The photo shows the home of Bob Parsons, who has documented the many times flooding has affected his home.
 
The mayor stated that parts of the city might not be habitable in 15 years, and that the city is already renovating impacted areas by raising home structures to higher levels, and raising roads.  Relocation to higher ground is also envisioned.  The U. S. Navy is replacing 14 piers because of rising water at a cost of US$490-560 million.
 
The Washington Post reported that according to the U. S. National Oceanic and Atmospheric Administration, Norfolk, together with a 600 mile section along the U. S. East Coast, is a “sea level rise hotspot”, with SLR expected to be 3-4 times the worldwide average.  Much of this is due to a change in the Atlantic Ocean Gulf Stream that directs more water toward the U. S. eastern shore.  Norfolk in addition is slowly subsiding into the sea due to geological factors.  A Virginia study projects that SLR in the Norfolk area could be 5 ½ feet (1.68 m) by the end of this century if the world does not institute mitigation measures to curb global warming.
The report states that Norfolk engaged a Dutch firm to design an adaptation plan to protect the city.  The resulting project, involving new flood gates, building higher roads and renovating the storm sewer system would protect against water 1 foot (31 cm) higher, and cost US$1 billion, more than the city’s current annual budget. 
 
Sea Level Rise Around the U. S.  An interactive map of coastal and tidal regions susceptible to ocean flooding around the U. S. shows the increasing loss of land area as the sea level rises between 1 foot and 9 feet (30 cm and 274 cm).
 
Projections of future SLR show severe further effects to the year 2100, and the year 2300.  Schaeffer and coworkers (Nature Climate Change 2012; DOI: 10.1038/NCLIMATE1584) developed projections based on the warming trajectories arising from several scenarios for emissions of greenhouse gases.  These range from a continued annual emissions rate in an essentially unconstrained scenario to one with a hypothetical stringent reduction to a zero emissions rate in 2016.  Their results are summarized in the following graphic.
Projected sea level rise under various greenhouse gas emission scenarios, ranging from unconstrained (CPH reference) to stringent reduction to zero emissions in 2016 (Zero 2016).  The colored bands give full uncertainty values within the graphic, and the shaded bars to the right, for only two cases, the lowest and highest SLR projections.  Note that the time axis (horizontal) and the SLR axis (vertical) use different scales in a and b.  a, Projections for 2000-2100; the vertical scale runs to about 43 in. b, Historical data from 1000 to 2000, and projections from 2000 to 2300 with the vertical gray shading showing the present 21st century; the vertical scale runs to about 13 feet.
 
The results of Schaeffer and coworkers reflect in numbers the notions expressed in the Introduction; namely, that as long as the global temperature operates to keep temperatures over land ice, and under ocean-based ice shelves, above their melting points, ice will melt and contribute to further SLR.  Temperature-induced expansion of the oceans continues in scenarios with continued emissions of greenhouse gases (the upper projections in the graphics), but this writer presumes that this contribution is reduced in scenarios with limits on emissions (lower projections in the graphics).  And since global temperature depends on the total accumulated level of greenhouse gases in the atmosphere, the temperature cannot go back to lower values, low enough to keep ice sheets and ice shelves frozen.  In contrast, panel b in the graphic above shows that sea level was essentially unchanged from the year 1000 until the beginning of the industrial revolution when humanity began burning fossil fuels.
 
Conclusion
 
The recent Risky Business report highlights the important role that risk analysis can play in planning future responses to global warming.  The effects of warming can be viewed as shifting a probability curve giving the likelihood of occurrence of an extreme event with major damaging effects “to the right”, i.e., in the direction of higher likelihood of occurrence.  An example drawn from the topic of this post could be an extreme effect from sea flooding due to rising temperatures.  Such disasters wreak significant socioeconomic hardship on those affected.  The report suggests that risk management could develop programs for investing in infrastructure to minimize future risk.
 
The risk of harms from SLR is extremely high, according to the model projections shown in the graphic above.  In the framework of the Risky Business report, risk management under these circumstances leads to the conclusion that investments to help mitigate further warming, as well as adaptive investments to strengthen infrastructure to withstand SLR, are both warranted.  Risk management should be adopted worldwide, since global warming is a universal phenomenon involving all nations that emit greenhouse gases, and the effects of SLR likewise are felt worldwide.
 
The risks arise because around the world, many cities are situated along coastlines, and as countries develop their populations tend to leave rural settings and gravitate to their cities.  Among developed countries also, many cities are in coastal settings. 
 
Focusing on the U. S., the examples of regular inundations from the ocean, described above, are not exceptional.  SLR aggravates tidal flooding, and sets the stage for more damaging storm surges in extreme weather events.  The financial costs of such damages are very large, and are met from public coffers and private risk insurance.  Both these coverages will increase as SLR worsens.
 
Risk management entails investments that would both minimize further warming and protect against damage when SLR threats are present.  Such investment would help lower future damage costs, and contribute significantly to the economy by increasing employment in the industries involved.  Thus the risk management evaluation of SLR and its attendant damages leads to activities that minimize future harms to coastal communities and expands economic growth.  Both of these outcomes are highly desirable.
 
© 2014 Henry Auer