See the Tabbed Pages for links to video tutorials, and a linked list of post titles grouped by topic.

This blog is expressly directed to readers who do not have strong training or backgrounds in science, with the intent of helping them grasp the underpinnings of this important issue. I'm going to present an ongoing series of posts that will develop various aspects of the science of global warming, its causes and possible methods for minimizing its advance and overcoming at least partially its detrimental effects.

Each post will begin with a capsule summary. It will then proceed with captioned sections to amplify and justify the statements and conclusions of the summary. I'll present images and tables where helpful to develop a point, since "a picture is worth a thousand words".

Showing posts with label emission allowances. Show all posts

Wednesday, March 27, 2013

Choose a Carbon Fee, Not a Cap and Trade Regime

Summary.   Burning fossil fuels generates carbon dioxide as waste whose socioeconomic costs to humanity are not accounted for in the price of the fuel.   Reducing our dependence on fossil fuel use and mitigation of emission of greenhouse gases have led to valuing carbon either by a fee or use of a cap and trade mechanism; the additional value would limit consumption.  A carbon fee is easy to implement legislatively or administratively, and has been effective in reducing demand for fossil fuels.  Cap and trade regimes are in place in many jurisdictions around the world.  They are administratively complex and bureaucratically onerous, and can be unsuccessful in curbing fossil fuel use.  This post expands on these factors, and concludes that lowering the use of fossil fuels is best accomplished by imposing a fee on carbon.


Introduction. 
Human activity generates waste.  Significantly, as we burn more and more fossil fuels to produce the energy that powers modern life, we emit more and more carbon dioxide into the atmosphere.  This substance, an important greenhouse gas, is being released as the waste product of our energy economy.
 
It is imperative to treat manmade carbon dioxide as a cost-bearing waste product because of the harmful effects of the global warming that it produces.  These harms carry enormous costs with them.  Properly accounting for these costs would make it more acceptable to make the investments needed to reduce greenhouse gas emissions.
 
Policy directed toward reducing dependence on fossil fuels and mitigating greenhouse gas (GHG) emissions has long grappled with the alternative policies of imposing a carbon fee on fossil fuels and creating a cap and trade regime.  These may be viewed as policies that affect, respectively, the demand for, and the supply of, fossil fuels.  A carbon fee levies an added cost on fossil fuels directly.  The fee is passed through directly to the consumer, affecting demand. Cap and trade mechanisms, on the other hand, place upper limits on the emission of carbon dioxide (CO2). 


This post reviews examples of both mitigation mechanisms.  Upon consideration we support the use of a carbon fee in preference to a cap and trade mechanism for mitigation.

A carbon fee is imposed on fossil fuels directly in accordance with the amount of CO2 produced when burned.  The fee is imposed and collected at, or close to, the source of the fuel.  The value of the fee is then passed along as the fuel is transformed (petroleum to gasoline, for example), and/or transported (all fuels), and is ultimately paid by the consumer.  The level of the fee is set by policymakers, and typically is envisioned to start low and rise periodically until it reaches an intended level.  It is seen that a carbon fee is conceptually and operationally easy to implement.  Clearly the fee operates to constrain demand.

Under cap-and-trade major emitting facilities are allotted allowances each of which licenses the release of a fixed amount, say 1 ton, of CO2 and other GHGs.  An administrative agency determines the total number of allowances (the cap) and the allotments for each period.  The cap is reduced year by year, thus constraining fuel consumption.  Ideally the emitters would pay for the allowances, frequently through an auction, but at the outset in many regimes they are distributed at no charge.  In any case, as the program matures markets are ultimately set up to auction annual allowances, and for trading them, thereby establishing a price for emissions.  The market price on carbon established in this market deters fossil fuel use. 

There are many problems with a cap-and-trade regime that make it difficult to succeed.  For example, if the supply of allowances is too high or the market demand is too low, their price will fall and the objective of reducing the rate of emissions of CO2 will be discouraged.  For these and other reasons discussed below, operation of a cap and trade regime is complex, if not cumbersome.  A cap and trade regime may be intricate and top-heavy to administer.

Both cap and trade and a carbon fee assign a monetary value to the waste stream that emissions of CO2 and other greenhouse gases represent.  This has not been done historically; CO2 has not been considered to be a waste product of our energy economy whose disposal had to be priced into the cost of the fossil fuels.
 
Examples of using a carbon tax.
In Australia, Prime Minister Julia Gillard’s government enacted a carbon fee program in 2011.  Initially the carbon fee is US$23.15 per ton of carbon; much of the revenue is to be applied as compensation to businesses and consumers (“cap and rebate”).  After six months of operation, the electricity generation segment of Australia’s energy economy reduced its carbon emissions rate by 8.6%.  Emissions were 7.5 million tonnes lower in the second half of 2012 than for the same period in 2011.  This arose from a decrease in demand and an increase in residential rooftop solar panel use and increased energy-efficiency.   Some coal-burning facilities ceased operating, while more power came from increased hydroelectric generation.  The long-term goal is to reduce emissions by 33 million tonnes per year by 2020.

Gasoline fees are very effective in affecting drivers’ travel habits.  The graphic below, characterizing how per capita fuel use reflects the size of the gasoline fee,

 
Sources: New York Times presenting data from the U. S. Department of Energy and the World Bank; http://www.nytimes.com/interactive/2012/09/11/business/Fuel-Taxes-and-Consumption.html?ref=business  


shows that per capita use of fuel for driving in developed countries decreases as the amount of the gas fee increases.  The U. S. has the lowest gas fee, which is correlated with the highest amount of fuel used per capita (horizontal scale). As the gas fee increases (vertical scale), it is seen that most of the benefit appears to be attained by a fee level of about US$2.20 per U. S. gallon.  In Great Britain, where the gas fee is even higher, Ford, the American car maker, sells a model of its compact Focus whose efficiency is 72 miles per U. S. gallon.  In contrast, a Focus model sold in the U. S. gets only 33 miles per U. S. gallon.  Clearly, automakers already have the technology and capability to mass produce highly fuel efficient cars.  This shows that the current state of technology is sufficient to garner significant improvements today.

Gasoline prices affect consumption.   In the U. S. the price of gasoline has fluctuated considerably in recent years for reasons that do not include imposition of a carbon fee.  The Washington Post reported on April 17, 2012 that higher gas prices had led to reduced consumption, and to a move toward the purchase of more fuel-efficient vehicles.

A review of various studies of the interrelationship between price and consumption concluded that “we can be reasonably assured that a rise in gas fees, all else being equal, will cause consumption to decrease”. 

Examples of using cap and trade.
In the U. S. the Regional Greenhouse Gas Initiative (RGGI) encompasses nine northeastern states.  RGGI controls only for emissions from fossil fuel plants that generate electricity, and affects only larger power plants.  RGGI created a CO2 cap and trade program, with the goal first of stabilizing and subsequently reducing the overall emissions from these plants.  Each state’s base emission amount was established at the outset, and is remaining fixed at that level from 2009 through 2014.  Starting in 2015, the allowances for each state are to be reduced by 2.5% per year, so that by 2018 the emissions will be 10% below the starting level.  Auctions for emission allowances occur quarterly.  RGGI estimates that the auction price increases the cost of electricity to the consumer by only 0.4% to 1%.

In its 19th auction, almost 38 million CO2 allowances were sold, garnering about US$106 million, or US$2.80 per allowance.  The cumulative amount from all auctions is about US$1.2 billion.  The proceeds are used to rebate portions of electricity bills to consumers, invest in the region’s renewable energy economy, including job training for environmental jobs, and similar objectives.  RGGI has already invested in improvements that will produce significant reductions of CO2 emissions and save the need for generating major amounts of electricity, as well as the thermal energy needed to drive the generators.

European Union (EU). Even before the entry into force of the Kyoto Protocol in 2005, the European Commission established its greenhouse gas emissions trading scheme (ETS) using a cap and trade market mechanism. As an accord intended to govern the operations of 27 sovereign nations, each country had to enact laws codifying the applicability of the ETS structure within its borders.

It covers at least 11,000 individual emission sources across the EU. The ETS is being implemented in three phases.

Phase 1, operating from 2005 to 2007, was characterized as a learning phase, and included such features as
  • The level of the emissions cap was determined largely by each nation independently;
  • It included only power plants with a capacity greater than 20 MW, and other industrial facilities; these represented 42% of emissions; and
  • Allocations of emission allowances relied primarily on recent historical records; they were offered at no cost.

In Phase 2 (2008-2012), features that expanded on those of Phase 1 included:
  • The level of the emissions cap conformed to the limits of the Kyoto Protocol; and
  • Limits on emissions from air travel were to begin in 2012.

Phase 3 (2013-2020) departs from the earlier phases in important ways:
  • National emissions caps were to be replaced by a single EU-wide cap; they decrease by 1.74% per year starting in 2010 with the objective of delivering 21% reduction referenced to 2005 by 2020;
  • 90% of the allowances will be sold by auction rather than being distributed free of cost.

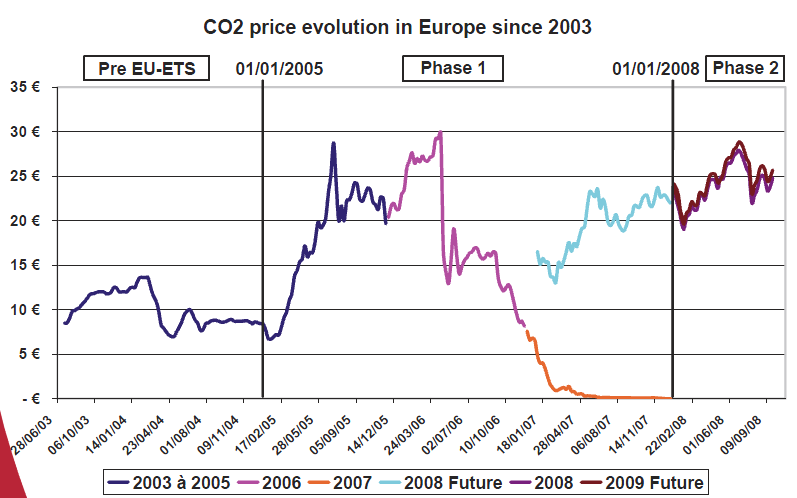
The performance of the ETS is shown below in the graphic.  Emissions allowances in a cap-and-trade regime were already in use in the EU prior to 2005. In Phase 1 it turns out that for a variety of reasons the auction market in these initial years established early prices as high as almost EUR30 (about US$39.20 at that time) per tonne of CO2 equivalents (blue and lavender lines; tonne, a metric ton), which then fell to EUR0/tonne toward the end of Phase 1 (orange line; see the graphic).
 
CO2 price evolution in the EU from 2003 to 2009.  Each period’s price performance is color coded as shown.  The pale aqua line represents futures trading for (the lower number of) allowances to be granted beginning at the start of Phase 2.  The EU-wide number of allowances for Phase 2 was 11.8% lower than for Phase 1.  Once Phase 2 began in 2008, the actual allowance price and the futures trading for 2009 allowances followed essentially identical paths.
Source: Estimations of carbon price in Europe, Nicole Dellero (2008)  http://ec.europa.eu/energy/nuclear/forum/opportunities/doc/competitiveness/2008-10-24/areva--co2prices.pdf.

 
The fall of the allowance price to EUR0/tonne in 2007 has been attributed both to a glut of allowances and to the impending economic slowdown preceding the world financial crisis of the coming years.  Of course, with allowances having no penalty value, emission sources were free to continue “business-as-usual”, rather than to curtail them.  On the other hand, when allowances had a significant price, businesses were able to pass along corresponding price increases to customers, which resulted in windfall profits.

The ETS had to cancel its most recent auction in March 2013 because bids received were “significantly” below the actual market rate.  In 2013, the start of Phase 3, about 40% of newly issued carbon emission allowances are being sold at auction for the first time.  The rest are still distributed at no charge.  The price had fallen by 5.6% to EUR3.73 (US$4.86) a metric ton, and reached a low on Jan. 31, 2013 of EUR3.42. 

Longer term the ETS price for emission allowances has fallen drastically, by 90%, in the last five years as demand for energy has fallen because of recessionary conditions among EU countries.  This has led to an oversupply of unused allowances.  The ETS is reevaluating its allocation of allowances, in an attempt to rebalance the trading system and maintain a price on emissions.

The state of California enacted its Global Warming Solutions Act in 2006, establishing mitigation goals through 2020.  The governor at the time, Arnold Schwarzenegger, extended the Act by executive order declaring further stringent mitigation objectives through 2050.  These actions are significant, because California constitutes about 1/6 of the U. S. economy in view of its large size and population.  The Act is also significant because in the U. S. it is the only economy-wide mitigation plan.  Inititally it covers most fixed point sources of emission, including electric generation plants and industrial facilities, beginning now (2012-3).  It will extend to refining and sale of transportation fuels (i.e., distributed sources) in 2015.  The mechanisms for undertaking its mitigation goals include a cap and trade system as well as continuing and expanding California’s historic, successful energy efficiency programs.  State officials and advisors are undertaking to learn lessons from the experience of the European Union’s ETS, seeking to avoid its mistakes.

The state established a rigorous survey of emissions from every potential covered installation in order to allocate emission allowances.  In its first auctions California sold 23.1 million allowances at US$10.09 each, in Nov. 2012, and another 12.9 million allowances at US$13.62 each at the second auction in Feb. 2013.  This works out to revenue from the first two auctions of US$409 million.
 
Analysis

Two major mechanisms have been devised to abate the emission of CO2, a major greenhouse gas, (aside from the important contribution of increasing the efficiency of energy usage).  One, a cap and trade regime, operates primarily by capping the supply of energy.  (Of course the auction price imposed on allowances has the effect of raising the price of the energy purchased by the consumer, so cap and trade may also have elements of lowering energy demand as well.)  The second, a carbon fee applied in proportion to the amount of CO2 emitted when the fossil fuel is burned, directly limits demand by raising the price paid for energy.

A cap and trade regime has many disadvantages in comparison to a carbon fee.  Some of these are apparent when considering the case of the European Union.  The factors, many of which are interrelated, include a) a need to account accurately for baseline emissions from each identified source prior to placing the regime in operation; b) a continued need for monitoring emissions from each source as the regime operates; c) a need for a  mechanism to allot allowances both at the outset and in subsequent periods of operation; d) a mechanism or rule for distributing allowances, including determining whether to grant or sell them; e) monitoring use of energy offsets by those installations unable to comply with emissions limits; and f) creating and maintaining the new administrative and bureaucratic offices needed to operate the regime.  It is seen from this incomplete list that a cap and trade regime presents many challenges, requires an extensive bureaucratic structure, and includes many opportunities for mistakes to be made that defeat the objective of constraining emissions.

In contrast, a carbon fee is extraordinarily simple in its operating features and is easy to implement.  A tax rate is established at the outset, covering most or all sources of CO2 emissions.  In order to achieve its objectives, it would be optimal to start with an insignificant tax rate, and then have the rate increase annually to a level at which it would have a meaningful effect in reducing energy demand.  The example cited in the gasoline fee graphic above provides ample evidence that a carbon fee is easy to apply, has a broad if not universal reach, and achieves its objective according to its magnitude.  It is clear that the simplicity and effectiveness of a carbon fee offers major advantages over use of a cap and trade regime.

Many commentators have urged use of a carbon fee to mitigate emissions.  One of the most consistent over time has been Tom Friedman, columnist for the New York Times, most recently in this article.   His writing and that of others have considered the many uses to which the revenues from pricing carbon could be applied.  This post will not address that discussion; most alternatives are worthy ones.
 
The time to begin abating humanity’s emissions of CO2, a major greenhouse gas, is now.  The longer we wait, the more firmly we cement our dependence on fossil fuels, and the more CO2 accumulates in the atmosphere, exacerbating global warming and its damaging effects on human life and welfare.  The simplest, most direct, and highly effective mechanism for reducing dependence on fossil fuels and mitigate emissions of GHGs is to apply a carbon fee.
 
© 2013
Henry Auer


Monday, January 23, 2012

The European Union’s Energy Policy. I. The Emissions Trading System

Summary.  Just prior to entry into force of the Kyoto Protocol in 2005 the European Union adopted a cap-and-trade market mechanism, the Emissions Trading System, to reduce emissions of carbon dioxide and other greenhouse gases.  The System has three phases of operation between 2005 and 2020, the current ending date of the System as devised. 

The System covers 11,000 or more individual facilities.  Phase 1, lasting 3 years, was intended as a trial period.  It suffered from problems in implementation which impeded its effectiveness during this interval.  Phase 2 lasts 5 years and is drawing to an end this year.  In Phase 2 the allocation of emission allowances and operation of the allowance market were optimized, and the coverage of emitting sources is expanded.  Phase 3 is to last to 2020.  Its allowances are to decrease each year, so that greenhouse gas emissions necessarily will fall, to a level about 20% lower than 2005.

The Emission Trading System affords a workable model for a cap-and-trade mechanism for lowering greenhouse gas emissions.  The world’s major emitters of greenhouse gases, China and the U. S., have not implemented national emissions limitation policies.  China, in its current 5 year plan, includes pilot projects using cap-and-trade and carbon taxes.  The U. S. has failed to enact an energy policy, although a cap-and-trade bill passed the lower chamber in 2009.  In order to minimize the significant harms that arise from extreme events ascribed to global warming, the nations of the world should reach agreement as soon as possible on an agreement to limit greenhouse gas emissions and embark on adaptation measures.

Introduction.  This post describes the EU’s Emission Trading System.  The following post considers various technologies envisioned in the EU that contribute to reducing emissions of greenhouse gases.

Climate scientists have determined unambiguously that the long-term global average of temperature has increased since the beginning of the Industrial Revolution (ca. 1850) by about 0.7ºC (1.3ºF) (Intergovernmental Panel on Climate Change (IPCC)).  This is ascribed to the increasing use of fossil fuels for energy that the Industrial Revolution brought on.  Fossil fuels burn to produce carbon dioxide (CO2), a significant greenhouse gas, in correspondingly increasing amounts.  The trends of fossil fuel use, increasing atmospheric concentration of CO2, and the rise of the long-term global average temperature correlate closely with each other, and are especially pronounced beginning in the second half of the 20th century. 

The Fourth Assessment Report of the IPCC, issued in 2007, determined that an essential objective is to limit the accumulation of greenhouse gases in the atmosphere such that the resulting global average temperature rise be less than 2ºC (3.6ºF). It states that “deep cuts in global greenhouse gas emissions are required according to [climate] science” to achieve this objective.  This is because higher global temperatures are predicted to cause damages from altered weather and climate events; these are already occurring, as evidenced variously by increased aridity and drought, or extreme rain and floods, and sea level rise, among other harmful effects, in recent years.

The Kyoto Protocol. In response to earlier assessments by the IPCC and other groups, the United Nations Framework Convention on Climate Change (UNFCCC) established guidelines for reducing humanity’s emissions of greenhouse gases, in the 1990’s.  The Kyoto Protocol, developed in 1998, established the goal of reducing the emission of CO2 by at least 5%, depending on the nation, below the level for 1990 by the period 2008 to 2012.  The European Union (EU) members at that time acceded to the Protocol with a reduction minimum of 8%, and began implementing programs intended to achieve this goal. The EU has expanded in more recent years, and currently numbers 27 countries, including nations of the former Soviet Union and others, encompassing 500 million people.  The Kyoto Protocol formally entered into force in 2005.  (Nations considered to be developing at the time the Protocol was negotiated, including China, were excluded from coverage.  The U. S. never ratified the Protocol and is likewise excluded.)

Emissions Trading System of the EU.  Even before the entry into force of the Kyoto Protocol, the European Commission established the formalities and the structures for a greenhouse gas emissions trading scheme (ETS) covering its members.  The mechanism for implementing the ETS was a cap-and-trade market mechanism.

In cap-and-trade, allowances granting permission to emit 1 tonne of CO2 initially are granted to emission sources, based on an assessment of their emissions rate.  (Later, the sources must acquire the allowances by bidding for them in an auction.)  The allowances are transferable, so that an inefficient facility that emits more CO2 than its allotment must purchase allowances to make up the difference.  The allowances are remitted to the ETS authorities periodically.  More efficient facilities will have excess allowances and can either trade them to a needy facility for an agreed price or save them for later use.  In addition to direct transfers of allowances by purchase, cap-and-trade envisions third-party allowance exchanges which openly buy and sell allowances as trading vehicles in close analogy to other financial exchanges.  The exchanges constitute the best mechanism for establishing a market value for allowances at any given time.  

Thus cap-and-trade mechanisms assign a monetary value to the waste stream that emissions of CO2 and other greenhouse gases represent.  This has not been done historically; CO2 has not been considered to be a waste product of our energy economy whose disposal or treatment had to be priced into the purchase value of the fossil fuels from which they originated (see this earlier post).  If allowances are sufficiently scarce, their price will be high enough to serve as an incentive for emitting sources to become more efficient and emit less CO2.  If the supply of allowances is ample, however, or the market demand is low, their price will fall and the objective of reducing the emissions rate will be discouraged.

Cap-and-trade markets work to reduce emissions by issuing successively lower numbers of allowances into a market region every year.  This limits their supply and should lead to higher prices needed for their purchase.  In addition, as noted above, annual allotments themselves can be issued into an exchange for purchase, rather than being granted at no cost.  The revenue accruing to the issuing agency, here the EU through the ETS, can be used to promote measures for further reduction in use of fossil fuels and in promoting economy-wide efficiency programs.

Operation of the EU Emissions Trading Scheme.  The ETS is being implemented in three phases:
          Phase 1.       2005-2007
          Phase 2.       2008-2012
          Phase 3.       2013-2020.
Since the Kyoto Protocol came into force in 2005, it is clear that planning for Phase I began before that time, and its structure was decided before that date.  As seen below in the chart, emissions allowances in a cap-and-trade regime were already in use prior to 2005.  As an accord intended to govern the operations of 27 sovereign nations, each one had to enact laws codifying the applicability of the ETS structure within its borders.

Phase 1 was characterized as a learning phase.  Its main features were:
  • The level of the emissions cap was determined largely by each nation, including additional negotiation with the European Commission;
  • It covered only CO2, and included only power plants with a capacity greater than 20 MW and other industrial facilities; these represented 42% of emissions;
  • Allocations of emission allowances relied primarily on recent historical records; they were offered at no cost; and
  • Offsets favoring an emitting source from emissions savings reached in projects outside the EU were allowed.

In Phase 2, features that expanded on those above included:
  • The level of the emissions cap conformed to the limits of the Kyoto Protocol;
  • Emissions of nitrous oxide (N2O) are partially covered as a greenhouse gas; and
  • Limits on emissions from air travel are to begin in 2012.

Phase 3 departs from the earlier phases in important ways:
  • National emissions caps are to be replaced by single EU-wide caps covering the entire region; they decrease by 1.74% per year starting in 2010 with the objective of delivering 21% reduction referenced to 2005 by 2020;
  • Additional greenhouse gases and a wider range of industries are to be covered;
  • Emissions allocations for electric generating plants will not be free; other industries begin with 80% of allowances free but diminishing to none free by 2020; and
  • 90% of the allowances will be sold by auction; the proceeds are to be distributed to the member nations according to their 2005 emissions.

Performance of the EU ETS. 

The ETS covers at least 11,000 individual emission sources across the EU.  For additional details concerning the allocation of allowances for Phase 1, see reference 1.

In Phase 1 it turns out that allowances were granted, in certain cases, in excess of need or previous national experience.  Each nation’s specification of the number of allowances it needed was based on historical experience, and acceded to by the EU.  Inadvertently issuance of allowances for Phase 1 was delayed.  For these and other reasons the auction market in these initial years established early prices as high as almost EUR30 per tonne of CO2 equivalents (tonne, a metric ton), which then fell to EUR0/tonne toward the end of Phase 1 (see the following chart).

Source: Estimations of post-2012 carbon price in Europe, Nicole Dellero (2008)  http://ec.europa.eu/energy/nuclear/forum/opportunities/doc/competitiveness/2008-10-24/areva--co2prices.pdf.


In this chart, each period’s price performance is color coded as shown.  The pale aqua line represents futures trading for (the lower number of) allowances to be granted beginning at the start of Phase 2.  The EU-wide number of allowances for Phase 2 was 11.8% lower than for Phase 1.  Once Phase 2 began in 2008, the actual allowance price and the futures trading for 2009 allowances followed essentially identical paths (see the chart).

The fall of the allowance price to EUR0/tonne in 2007 has been attributed both to the glut of allowances and to the impending economic slowdown preceding the world financial crisis of the coming years.  Of course, with allowances having no penalty value, sources were free to continue “business-as-usual” rates of emission, rather than to curtail them.  On the other hand, when allowances had a significant price, businesses were able to pass along corresponding price increases to customers, which resulted in windfall profits.
                                             
In Phase 3, in addition to the features itemized above, importantly the EU will centrally receive reports on, and verify, emissions from each facility.

Individual firms can reduce emissions and/or generate market profits under the ETS.  They can optionally phase out coal-fired electricity plants by shifting to renewables or gas, improve efficiency by investing in new equipment and creating cogeneration facilities, obtain offsets from emission-reducing programs outside the EU, if available shift generating or manufacturing loads to more efficient facilities, purchase allowances from more efficient companies, and actively trade on allowance exchanges.

Recent ETS results.

According to EurActive (accessed Jan. 21, 2012) industrial emissions of CO2 fell in 2009 by 11% from the previous year.  This reflected the diminished economic activity brought on by the global recession.  Overall for the EU, emissions in 2009 fell by 7% year-on-year, due to the recession and the growth of renewable energy sources, according the European Environmental Agency (EEA; accessed Jan. 22, 2012). For 2009, emissions were below the pre-established cap, meaning that EU industrial establishments had surplus allowances that remained unused.  (Under the EU ETS, unused allowances can be saved for future use within a phase, and can even be carried forward to the next phase.  Thus the recession could potentially affect the market price for allowances for many years to come.)  EU emissions for 2010 increased 2.4% year-on-year, but the EEA believes the EU is still on track to achieve its Kyoto Protocol emission reduction objective for 2012.  The increased emissions for 2010 compared to 2009 reflect recovery from the recession in Europe as well as the effects of an unusually cold winter which led to increased heating from fossil fuels.

As of Nov. 22, 2011, EEA states that overall EU emissions for 2010 were 15.5% below the reference level of 1990 emissions.  For the original EU-15 (the EU membership at the time of the Kyoto Protocol), the emissions reduction was 10.7% as of 2010, well ahead of the goal of 8% by 2012 established under the Kyoto Protocol.  The EEA points out that, in order to achieve the EU reduction goal of 20% by 2020, additional measures will have to be implemented.  These would presumably include putting the additional policies identified for phase 3 into practice.

Using alternative data and sources, CO2 emissions and per capita emissions of the full EU-27, the original EU-15 and the U. S. are compared in the table below.   

CO2 emissions in 2010 (million tonnes CO2) and CO2/capita emissions 1990-2010 (unit: tonne CO2/person)

Per capita emissions


Emis-sions 2010
1990
2000
2010
Change 1990-2010
Change
in %
Change in CO2, %
Change in population, %
United States
5,250
19.7
20.8
16.9
-2.8
-14%
5%
23%
EU-27
4,050
9.2
8.5
8.1
-1.1
-12%
-7%
6%
EU-15
3,150
9.1
8.8
7.9
-1.2
-13%
-5%
9%

EU-27 = Full 27 current Member States.
EU-15 = 15 EU Member States at the time the Kyoto Protocol was ratified.
Source: Olivier, J.G.J., Janssens-Maenhout, G., et al., (2011), Long-term trend in global CO2 emissions. 2011 report, The Hague: PBL/JRC (accessed 01/21/12). http://edgar.jrc.ec.europa.eu/news_docs/C02%20Mondiaal_%20webdef_19sept.pdf


Annual greenhouse gas emission trends, and projections to 2020, under the EU ETS are shown in the following graphic.

GHG trends and projections 1990–2020 — total emissions.  Bunkers = fuel oil used in marine shipping.  The dotted line represents the goal for reduction of emissions by 2020 under the EU ETS.  Projections with existing measures represent the policies in place under Phase 2 of the ETS.  Projections with additional measures represent the policies to be implemented under Phase 3. Emissions included in emission trading (EU ETS) represents those portions of greenhouse gas emissions regulated under the ETS during Phase 1 and Phase 2, beginning in 2005.  Source: European Environmental Agency (accessed 01/23/12);


The pale blue bars representing the emissions experience under the EU ETS through 2010 reflect the performance under Phase 1 (2005-2007) and the first three years under Phase 2 (2008-2010).  It is seen that regulated emissions increased during Phase 1, presumably reflecting the initial problems encountered in issuing and pricing emission allowances.  Performance during Phase 2 appears to be improving, as may be expected from the expanded coverage and the improved auction market for allowances.

Emissions projected through 2020 continuing the policies of Phase 2 lead to modest reductions in emissions, but are predicted not to suffice to attain the ETS goal of a 20% reduction by 2020 (dashed line).  Implementing expanded emissions reduction policies such as those of Phase 3 are expected to approach the reduction needed to reach the ETS 2020 goal.

The graphic below compares CO2 emission of the U. S., EU27 and EU15 over 20 years from 1990 to 2010 with those of China.  Whereas emissions of the EU nations

                          0                                                                 10,000
                                      Millions of tonnes of CO2
Source: Olivier, J.G.J., Janssens-Maenhout, G., et al., (2011), Long-term trend in global CO2 emissions. 2011 report, The Hague: PBL/JRC. http://edgar.jrc.ec.europa.eu/news_docs/C02%20Mondiaal_%20webdef_19sept.pdf


decreased during this interval, those of the U. S. increased modestly, and show a significant reduction in the second decade of this period.  In contrast, CO2 emissions for China show a dramatic absolute increase, by about 350%, over the same two decades.  Clearly, China (and other developing countries of the world) need to embark on drastic policies to reduce their emissions in order for global greenhouse gas levels to stabilize at a level that avoids the most extreme of the predicted consequences of continued global warming.

Conclusions

The European Union implemented its Emissions Trading System in 2005; clearly, planning for this program began even before entry into force of the Kyoto Protocol in that year.  Establishing the ETS has been a significant achievement, as it required that each of the 27 current EU members enact enabling legislation built around the supranational framework of the ETS.  Because the EU ETS was the earliest emissions reduction program implemented in the world, achieved legislative backing from every member nation, and established significant goals for reducing greenhouse gas emission, it represents a significant step for the world of limiting emissions and constraining the rise of the planet’s long term average temperature.

The ETS is built around an emissions cap and allowance trading mechanism.  Its first three years of operation, termed Phase 1, was overtly acknowledged to be a trial period.  Indeed this turned out to be necessary, for the mechanism for allocating allowances turned out to be too generous, and the auction market for allowances at the outset was not seamless; the auction price fell to EUR0.  Now nearing the end of Phase 2, the ETS will be smoother in many ways, and will affect a larger number of emissions sources, as the EU enters Phase 3.

In the U. S., cap-and-trade emissions markets underlie the Northeastern states’ Regional Greenhouse Gas Initiative (RGGI; see this post) and California’s Global Warming Solutions Act (see this post).  RGGI has been operating for a few years, although its goals are quite limited.  The U. S. House of Representatives passed an energy bill including a cap-and-trade emissions reduction mechanism in 2009 modeled after the EU ETS, but no action was taken in the Senate and the bill was never enacted into law.

Emissions rates of China and the U. S. are the world’s first and second highest.  Neither nation is bound by the Kyoto Protocol; China because at the time of its negotiation developing countries were excluded from coverage, and the U. S. because the Senate voted unanimously against considering it for ratification.  Since that time, the 193 nations of the UNFCCC have been unable, in spite of annual gatherings, to craft a successor to the Kyoto Protocol, which expires at the end of 2012.  Currently the earliest date for placing a successor agreement in force may be 2020 (see this post on the Durban Platform).   In the meantime, as seen above, China and other countries continue to expand their annual rate of greenhouse gas emissions at a rapid pace as they seek to attain a level of industrialization comparable to that of developed countries.  The U. S., in the absence of a unified national legislated energy policy, continues to create a partial patchwork of various state-based and regional energy programs of differing scope and ambition.

Cap-and-trade acts on the supply side of the energy economy by constraining fossil-fuel based energy output.  Carbon taxes on fossil fuels, if implemented, would act on the demand side, constraining fuel and energy use.  Neither regime is without its problems and detractors, but this writer favors a carbon tax (one example is described in this post) for its directness and simplicity of operation, assuming exceptions to coverage are minimal.  A major objection has to do with a perceived constraint on economic activity because purchasing power may be drained off by the tax.  This can be countered by an annual rebate to fossil fuel consumers; even so the principal objective, creating a psychological restraint of demand would be achieved.  Revenue from the tax should also support deployment of renewable energy, thereby supporting new employment in the energy economy.

The nations of the world need to come together to limit greenhouse gases as soon as possible, in order to minimize the harms arising from global warming.  The EU ETS provides a demonstration of one way to contribute to achieving this goal.
References

1. Estimations of post-2012 carbon price in Europe, Nicole Dellero (2008)  (Slide presentation); http://ec.europa.eu/energy/nuclear/forum/opportunities/doc/competitiveness/2008-10-24/areva--.co2prices.pdf

2. Making Cap-And-Trade Work: Lessons From The European Union Experience, Daniel C. Matisoff, Environment Magazine, Jan.-Feb. 2010; http://www.environmentmagazine.org/Archives/Back%20Issues/January-February%202010/making-capfull.html.

3. Long-term trend in global CO2 emissions. 2011 report, Olivier, J.G.J., Janssens-Maenhout, G., et al., (2011), The Hague: PBL Netherlands Environmental Assessment Agency and European Commission’s Joint Research Centre; http://edgar.jrc.ec.europa.eu/news_docs/C02%20Mondiaal_%20webdef_19sept.pdf

4. Approximated EU GHG inventory: early estimates for 2010; European Environmental Agency, Copenhagen, 2011;  http://www.eea.europa.eu/publications/approximated-eu-ghg-inventory-2010.

© 2011 Henry Auer