See the Tabbed Pages for links to video tutorials, and a linked list of post titles grouped by topic.

This blog is expressly directed to readers who do not have strong training or backgrounds in science, with the intent of helping them grasp the underpinnings of this important issue. I'm going to present an ongoing series of posts that will develop various aspects of the science of global warming, its causes and possible methods for minimizing its advance and overcoming at least partially its detrimental effects.

Each post will begin with a capsule summary. It will then proceed with captioned sections to amplify and justify the statements and conclusions of the summary. I'll present images and tables where helpful to develop a point, since "a picture is worth a thousand words".

Showing posts with label RGGI. Show all posts

Monday, January 23, 2012

The European Union’s Energy Policy. I. The Emissions Trading System

Summary.  Just prior to entry into force of the Kyoto Protocol in 2005 the European Union adopted a cap-and-trade market mechanism, the Emissions Trading System, to reduce emissions of carbon dioxide and other greenhouse gases.  The System has three phases of operation between 2005 and 2020, the current ending date of the System as devised. 

The System covers 11,000 or more individual facilities.  Phase 1, lasting 3 years, was intended as a trial period.  It suffered from problems in implementation which impeded its effectiveness during this interval.  Phase 2 lasts 5 years and is drawing to an end this year.  In Phase 2 the allocation of emission allowances and operation of the allowance market were optimized, and the coverage of emitting sources is expanded.  Phase 3 is to last to 2020.  Its allowances are to decrease each year, so that greenhouse gas emissions necessarily will fall, to a level about 20% lower than 2005.

The Emission Trading System affords a workable model for a cap-and-trade mechanism for lowering greenhouse gas emissions.  The world’s major emitters of greenhouse gases, China and the U. S., have not implemented national emissions limitation policies.  China, in its current 5 year plan, includes pilot projects using cap-and-trade and carbon taxes.  The U. S. has failed to enact an energy policy, although a cap-and-trade bill passed the lower chamber in 2009.  In order to minimize the significant harms that arise from extreme events ascribed to global warming, the nations of the world should reach agreement as soon as possible on an agreement to limit greenhouse gas emissions and embark on adaptation measures.

Introduction.  This post describes the EU’s Emission Trading System.  The following post considers various technologies envisioned in the EU that contribute to reducing emissions of greenhouse gases.

Climate scientists have determined unambiguously that the long-term global average of temperature has increased since the beginning of the Industrial Revolution (ca. 1850) by about 0.7ºC (1.3ºF) (Intergovernmental Panel on Climate Change (IPCC)).  This is ascribed to the increasing use of fossil fuels for energy that the Industrial Revolution brought on.  Fossil fuels burn to produce carbon dioxide (CO2), a significant greenhouse gas, in correspondingly increasing amounts.  The trends of fossil fuel use, increasing atmospheric concentration of CO2, and the rise of the long-term global average temperature correlate closely with each other, and are especially pronounced beginning in the second half of the 20th century. 

The Fourth Assessment Report of the IPCC, issued in 2007, determined that an essential objective is to limit the accumulation of greenhouse gases in the atmosphere such that the resulting global average temperature rise be less than 2ºC (3.6ºF). It states that “deep cuts in global greenhouse gas emissions are required according to [climate] science” to achieve this objective.  This is because higher global temperatures are predicted to cause damages from altered weather and climate events; these are already occurring, as evidenced variously by increased aridity and drought, or extreme rain and floods, and sea level rise, among other harmful effects, in recent years.

The Kyoto Protocol. In response to earlier assessments by the IPCC and other groups, the United Nations Framework Convention on Climate Change (UNFCCC) established guidelines for reducing humanity’s emissions of greenhouse gases, in the 1990’s.  The Kyoto Protocol, developed in 1998, established the goal of reducing the emission of CO2 by at least 5%, depending on the nation, below the level for 1990 by the period 2008 to 2012.  The European Union (EU) members at that time acceded to the Protocol with a reduction minimum of 8%, and began implementing programs intended to achieve this goal. The EU has expanded in more recent years, and currently numbers 27 countries, including nations of the former Soviet Union and others, encompassing 500 million people.  The Kyoto Protocol formally entered into force in 2005.  (Nations considered to be developing at the time the Protocol was negotiated, including China, were excluded from coverage.  The U. S. never ratified the Protocol and is likewise excluded.)

Emissions Trading System of the EU.  Even before the entry into force of the Kyoto Protocol, the European Commission established the formalities and the structures for a greenhouse gas emissions trading scheme (ETS) covering its members.  The mechanism for implementing the ETS was a cap-and-trade market mechanism.

In cap-and-trade, allowances granting permission to emit 1 tonne of CO2 initially are granted to emission sources, based on an assessment of their emissions rate.  (Later, the sources must acquire the allowances by bidding for them in an auction.)  The allowances are transferable, so that an inefficient facility that emits more CO2 than its allotment must purchase allowances to make up the difference.  The allowances are remitted to the ETS authorities periodically.  More efficient facilities will have excess allowances and can either trade them to a needy facility for an agreed price or save them for later use.  In addition to direct transfers of allowances by purchase, cap-and-trade envisions third-party allowance exchanges which openly buy and sell allowances as trading vehicles in close analogy to other financial exchanges.  The exchanges constitute the best mechanism for establishing a market value for allowances at any given time.  

Thus cap-and-trade mechanisms assign a monetary value to the waste stream that emissions of CO2 and other greenhouse gases represent.  This has not been done historically; CO2 has not been considered to be a waste product of our energy economy whose disposal or treatment had to be priced into the purchase value of the fossil fuels from which they originated (see this earlier post).  If allowances are sufficiently scarce, their price will be high enough to serve as an incentive for emitting sources to become more efficient and emit less CO2.  If the supply of allowances is ample, however, or the market demand is low, their price will fall and the objective of reducing the emissions rate will be discouraged.

Cap-and-trade markets work to reduce emissions by issuing successively lower numbers of allowances into a market region every year.  This limits their supply and should lead to higher prices needed for their purchase.  In addition, as noted above, annual allotments themselves can be issued into an exchange for purchase, rather than being granted at no cost.  The revenue accruing to the issuing agency, here the EU through the ETS, can be used to promote measures for further reduction in use of fossil fuels and in promoting economy-wide efficiency programs.

Operation of the EU Emissions Trading Scheme.  The ETS is being implemented in three phases:
          Phase 1.       2005-2007
          Phase 2.       2008-2012
          Phase 3.       2013-2020.
Since the Kyoto Protocol came into force in 2005, it is clear that planning for Phase I began before that time, and its structure was decided before that date.  As seen below in the chart, emissions allowances in a cap-and-trade regime were already in use prior to 2005.  As an accord intended to govern the operations of 27 sovereign nations, each one had to enact laws codifying the applicability of the ETS structure within its borders.

Phase 1 was characterized as a learning phase.  Its main features were:
  • The level of the emissions cap was determined largely by each nation, including additional negotiation with the European Commission;
  • It covered only CO2, and included only power plants with a capacity greater than 20 MW and other industrial facilities; these represented 42% of emissions;
  • Allocations of emission allowances relied primarily on recent historical records; they were offered at no cost; and
  • Offsets favoring an emitting source from emissions savings reached in projects outside the EU were allowed.

In Phase 2, features that expanded on those above included:
  • The level of the emissions cap conformed to the limits of the Kyoto Protocol;
  • Emissions of nitrous oxide (N2O) are partially covered as a greenhouse gas; and
  • Limits on emissions from air travel are to begin in 2012.

Phase 3 departs from the earlier phases in important ways:
  • National emissions caps are to be replaced by single EU-wide caps covering the entire region; they decrease by 1.74% per year starting in 2010 with the objective of delivering 21% reduction referenced to 2005 by 2020;
  • Additional greenhouse gases and a wider range of industries are to be covered;
  • Emissions allocations for electric generating plants will not be free; other industries begin with 80% of allowances free but diminishing to none free by 2020; and
  • 90% of the allowances will be sold by auction; the proceeds are to be distributed to the member nations according to their 2005 emissions.

Performance of the EU ETS. 

The ETS covers at least 11,000 individual emission sources across the EU.  For additional details concerning the allocation of allowances for Phase 1, see reference 1.

In Phase 1 it turns out that allowances were granted, in certain cases, in excess of need or previous national experience.  Each nation’s specification of the number of allowances it needed was based on historical experience, and acceded to by the EU.  Inadvertently issuance of allowances for Phase 1 was delayed.  For these and other reasons the auction market in these initial years established early prices as high as almost EUR30 per tonne of CO2 equivalents (tonne, a metric ton), which then fell to EUR0/tonne toward the end of Phase 1 (see the following chart).

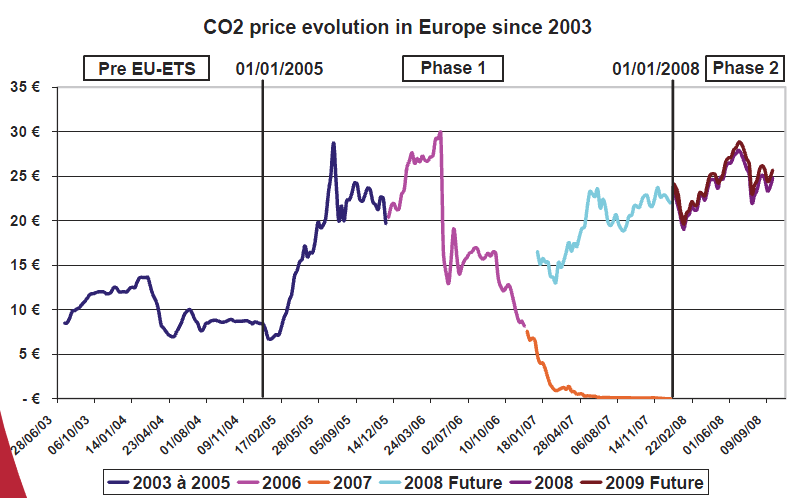
Source: Estimations of post-2012 carbon price in Europe, Nicole Dellero (2008)  http://ec.europa.eu/energy/nuclear/forum/opportunities/doc/competitiveness/2008-10-24/areva--co2prices.pdf.


In this chart, each period’s price performance is color coded as shown.  The pale aqua line represents futures trading for (the lower number of) allowances to be granted beginning at the start of Phase 2.  The EU-wide number of allowances for Phase 2 was 11.8% lower than for Phase 1.  Once Phase 2 began in 2008, the actual allowance price and the futures trading for 2009 allowances followed essentially identical paths (see the chart).

The fall of the allowance price to EUR0/tonne in 2007 has been attributed both to the glut of allowances and to the impending economic slowdown preceding the world financial crisis of the coming years.  Of course, with allowances having no penalty value, sources were free to continue “business-as-usual” rates of emission, rather than to curtail them.  On the other hand, when allowances had a significant price, businesses were able to pass along corresponding price increases to customers, which resulted in windfall profits.
                                             
In Phase 3, in addition to the features itemized above, importantly the EU will centrally receive reports on, and verify, emissions from each facility.

Individual firms can reduce emissions and/or generate market profits under the ETS.  They can optionally phase out coal-fired electricity plants by shifting to renewables or gas, improve efficiency by investing in new equipment and creating cogeneration facilities, obtain offsets from emission-reducing programs outside the EU, if available shift generating or manufacturing loads to more efficient facilities, purchase allowances from more efficient companies, and actively trade on allowance exchanges.

Recent ETS results.

According to EurActive (accessed Jan. 21, 2012) industrial emissions of CO2 fell in 2009 by 11% from the previous year.  This reflected the diminished economic activity brought on by the global recession.  Overall for the EU, emissions in 2009 fell by 7% year-on-year, due to the recession and the growth of renewable energy sources, according the European Environmental Agency (EEA; accessed Jan. 22, 2012). For 2009, emissions were below the pre-established cap, meaning that EU industrial establishments had surplus allowances that remained unused.  (Under the EU ETS, unused allowances can be saved for future use within a phase, and can even be carried forward to the next phase.  Thus the recession could potentially affect the market price for allowances for many years to come.)  EU emissions for 2010 increased 2.4% year-on-year, but the EEA believes the EU is still on track to achieve its Kyoto Protocol emission reduction objective for 2012.  The increased emissions for 2010 compared to 2009 reflect recovery from the recession in Europe as well as the effects of an unusually cold winter which led to increased heating from fossil fuels.

As of Nov. 22, 2011, EEA states that overall EU emissions for 2010 were 15.5% below the reference level of 1990 emissions.  For the original EU-15 (the EU membership at the time of the Kyoto Protocol), the emissions reduction was 10.7% as of 2010, well ahead of the goal of 8% by 2012 established under the Kyoto Protocol.  The EEA points out that, in order to achieve the EU reduction goal of 20% by 2020, additional measures will have to be implemented.  These would presumably include putting the additional policies identified for phase 3 into practice.

Using alternative data and sources, CO2 emissions and per capita emissions of the full EU-27, the original EU-15 and the U. S. are compared in the table below.   

CO2 emissions in 2010 (million tonnes CO2) and CO2/capita emissions 1990-2010 (unit: tonne CO2/person)

Per capita emissions


Emis-sions 2010
1990
2000
2010
Change 1990-2010
Change
in %
Change in CO2, %
Change in population, %
United States
5,250
19.7
20.8
16.9
-2.8
-14%
5%
23%
EU-27
4,050
9.2
8.5
8.1
-1.1
-12%
-7%
6%
EU-15
3,150
9.1
8.8
7.9
-1.2
-13%
-5%
9%

EU-27 = Full 27 current Member States.
EU-15 = 15 EU Member States at the time the Kyoto Protocol was ratified.
Source: Olivier, J.G.J., Janssens-Maenhout, G., et al., (2011), Long-term trend in global CO2 emissions. 2011 report, The Hague: PBL/JRC (accessed 01/21/12). http://edgar.jrc.ec.europa.eu/news_docs/C02%20Mondiaal_%20webdef_19sept.pdf


Annual greenhouse gas emission trends, and projections to 2020, under the EU ETS are shown in the following graphic.

GHG trends and projections 1990–2020 — total emissions.  Bunkers = fuel oil used in marine shipping.  The dotted line represents the goal for reduction of emissions by 2020 under the EU ETS.  Projections with existing measures represent the policies in place under Phase 2 of the ETS.  Projections with additional measures represent the policies to be implemented under Phase 3. Emissions included in emission trading (EU ETS) represents those portions of greenhouse gas emissions regulated under the ETS during Phase 1 and Phase 2, beginning in 2005.  Source: European Environmental Agency (accessed 01/23/12);


The pale blue bars representing the emissions experience under the EU ETS through 2010 reflect the performance under Phase 1 (2005-2007) and the first three years under Phase 2 (2008-2010).  It is seen that regulated emissions increased during Phase 1, presumably reflecting the initial problems encountered in issuing and pricing emission allowances.  Performance during Phase 2 appears to be improving, as may be expected from the expanded coverage and the improved auction market for allowances.

Emissions projected through 2020 continuing the policies of Phase 2 lead to modest reductions in emissions, but are predicted not to suffice to attain the ETS goal of a 20% reduction by 2020 (dashed line).  Implementing expanded emissions reduction policies such as those of Phase 3 are expected to approach the reduction needed to reach the ETS 2020 goal.

The graphic below compares CO2 emission of the U. S., EU27 and EU15 over 20 years from 1990 to 2010 with those of China.  Whereas emissions of the EU nations

                          0                                                                 10,000
                                      Millions of tonnes of CO2
Source: Olivier, J.G.J., Janssens-Maenhout, G., et al., (2011), Long-term trend in global CO2 emissions. 2011 report, The Hague: PBL/JRC. http://edgar.jrc.ec.europa.eu/news_docs/C02%20Mondiaal_%20webdef_19sept.pdf


decreased during this interval, those of the U. S. increased modestly, and show a significant reduction in the second decade of this period.  In contrast, CO2 emissions for China show a dramatic absolute increase, by about 350%, over the same two decades.  Clearly, China (and other developing countries of the world) need to embark on drastic policies to reduce their emissions in order for global greenhouse gas levels to stabilize at a level that avoids the most extreme of the predicted consequences of continued global warming.

Conclusions

The European Union implemented its Emissions Trading System in 2005; clearly, planning for this program began even before entry into force of the Kyoto Protocol in that year.  Establishing the ETS has been a significant achievement, as it required that each of the 27 current EU members enact enabling legislation built around the supranational framework of the ETS.  Because the EU ETS was the earliest emissions reduction program implemented in the world, achieved legislative backing from every member nation, and established significant goals for reducing greenhouse gas emission, it represents a significant step for the world of limiting emissions and constraining the rise of the planet’s long term average temperature.

The ETS is built around an emissions cap and allowance trading mechanism.  Its first three years of operation, termed Phase 1, was overtly acknowledged to be a trial period.  Indeed this turned out to be necessary, for the mechanism for allocating allowances turned out to be too generous, and the auction market for allowances at the outset was not seamless; the auction price fell to EUR0.  Now nearing the end of Phase 2, the ETS will be smoother in many ways, and will affect a larger number of emissions sources, as the EU enters Phase 3.

In the U. S., cap-and-trade emissions markets underlie the Northeastern states’ Regional Greenhouse Gas Initiative (RGGI; see this post) and California’s Global Warming Solutions Act (see this post).  RGGI has been operating for a few years, although its goals are quite limited.  The U. S. House of Representatives passed an energy bill including a cap-and-trade emissions reduction mechanism in 2009 modeled after the EU ETS, but no action was taken in the Senate and the bill was never enacted into law.

Emissions rates of China and the U. S. are the world’s first and second highest.  Neither nation is bound by the Kyoto Protocol; China because at the time of its negotiation developing countries were excluded from coverage, and the U. S. because the Senate voted unanimously against considering it for ratification.  Since that time, the 193 nations of the UNFCCC have been unable, in spite of annual gatherings, to craft a successor to the Kyoto Protocol, which expires at the end of 2012.  Currently the earliest date for placing a successor agreement in force may be 2020 (see this post on the Durban Platform).   In the meantime, as seen above, China and other countries continue to expand their annual rate of greenhouse gas emissions at a rapid pace as they seek to attain a level of industrialization comparable to that of developed countries.  The U. S., in the absence of a unified national legislated energy policy, continues to create a partial patchwork of various state-based and regional energy programs of differing scope and ambition.

Cap-and-trade acts on the supply side of the energy economy by constraining fossil-fuel based energy output.  Carbon taxes on fossil fuels, if implemented, would act on the demand side, constraining fuel and energy use.  Neither regime is without its problems and detractors, but this writer favors a carbon tax (one example is described in this post) for its directness and simplicity of operation, assuming exceptions to coverage are minimal.  A major objection has to do with a perceived constraint on economic activity because purchasing power may be drained off by the tax.  This can be countered by an annual rebate to fossil fuel consumers; even so the principal objective, creating a psychological restraint of demand would be achieved.  Revenue from the tax should also support deployment of renewable energy, thereby supporting new employment in the energy economy.

The nations of the world need to come together to limit greenhouse gases as soon as possible, in order to minimize the harms arising from global warming.  The EU ETS provides a demonstration of one way to contribute to achieving this goal.
References

1. Estimations of post-2012 carbon price in Europe, Nicole Dellero (2008)  (Slide presentation); http://ec.europa.eu/energy/nuclear/forum/opportunities/doc/competitiveness/2008-10-24/areva--.co2prices.pdf

2. Making Cap-And-Trade Work: Lessons From The European Union Experience, Daniel C. Matisoff, Environment Magazine, Jan.-Feb. 2010; http://www.environmentmagazine.org/Archives/Back%20Issues/January-February%202010/making-capfull.html.

3. Long-term trend in global CO2 emissions. 2011 report, Olivier, J.G.J., Janssens-Maenhout, G., et al., (2011), The Hague: PBL Netherlands Environmental Assessment Agency and European Commission’s Joint Research Centre; http://edgar.jrc.ec.europa.eu/news_docs/C02%20Mondiaal_%20webdef_19sept.pdf

4. Approximated EU GHG inventory: early estimates for 2010; European Environmental Agency, Copenhagen, 2011;  http://www.eea.europa.eu/publications/approximated-eu-ghg-inventory-2010.

© 2011 Henry Auer
 

Saturday, April 2, 2011

America’s Energy Security: President Obama’s Plan

Summary.  Global warming due to man-made greenhouse gas emissions remains a serious, unsolved problem facing the world.  Many major emitters, including the United States, remain without effective plans to reduce their emissions. 

As the Libyan oil crisis continues to contribute to a sudden spike in crude oil futures prices, leading to a sudden increase in gasoline prices in the U. S., President Obama delivered a speech on America’s Energy Security on March 30, 2011.  Emphasizing measures to modulate gasoline prices, he set forth goals of reducing foreign oil imports and promoting alternative energy sources.  The speech failed to seize the moment, however, to teach the American public about the critical need for curbing use of all fossil fuels and developing alternatives.  The U. S. still needs a comprehensive energy policy for the future.  We must hope that this Administration can remedy this failing.

Introduction.  According to T. Boone Pickens, the “Oracle of Oil”, the U. S. is the only country without a national energy plan (presentation at Yale U., 03/24/11).  The U.N.’s Intergovernmental Panel on Climate Change recommends that global warming from the start of the industrial revolution be limited to 3.6 deg F.  This principle is incorporated into the Cancun conference agreement of November 2011. Drastic reductions in emissions of greenhouse gases need to be implemented right away.  Climate scientists show that even if no new facilities using fossil fuels were built starting now, the global average temperature would continue rising before leveling off because of existing fuel-burning facilities.

European and U. S. Regional Energy Plans.  The European Union recently issued its Energy Roadmap for 2050with the goal of reducing greenhouse gas emissions by 80% from the levels measured in 1990 by 2050.  In the U. S., by contrast, the absence of a national energy policy has led in recent years to three regional programs, the Western Climate Initiative, the Midwest Greenhouse Gas Reduction Accord, and the northeast and mid-Atlantic Regional Greenhouse Gas Initiative.  Although the three plans differ in the details of their goals and coverage, all use a cap-and-trade mechanism to reduce emissions. This patchwork of plans begs for a single nation-wide plan. 

President Obama’s energy plan, presented in his speech and Fact Sheet: America’s Energy Security of March 30, 2011, proposes to cut imports of oil into the U. S. by one-third by 2025. This goal appears to be a response to the Libyan revolution-induced oil crisis, which has led to increased gasoline prices.  Since imports make up more than half of total U. S. oil use, this reduction corresponds to only about 16% of overall usage by 2025.  This is to be achieved by a combination of increasing domestic and international oil production, a switch to natural gas and biofuels from petroleum, and increased production of cars and trucks with higher fuel economy.  The plan also calls for expanded production of electric vehicles.  It promotes a Clean Energy Standard by which 80% of electricity generation in the U. S. will be from sources that avoid greenhouse gas emissions by 2035, including “clean coal”.  Overall, this plan presents many useful and worthy objectives to improve the U. S.’s energy situation.

The President’s plan, however, falls short in many respects.  Rather than formulating a single unified distinct goal such as the E.U.’s Roadmap, or any of the regional American accords, the President’s approach resembles more a shopping list of things “to-do”. The emphasis is on retaining or even expanding petroleum or natural gas for vehicle fuel, and on biofuels.  The global warming threat, however, requires weaning the country from all fossil fuels right away.  Similar emphasis was placed on domestic natural gas, which should not be a long-term solution.  Practically no mention was made of eliminating coal, the fuel producing the most CO2 emissions compared to the useful energy obtained, from electric power.  The notion of “clean coal”, mentioned only in passing, remains to be vindicated as a successful method capable of application at the large scale required.  It is imperative to move away from coal.   Furthermore, there is no incentive, such as cap-and-trade, a carbon tax, or other policy, to motivate relinquishing conventional energy sources and adoption of alternative energy sources.

Conclusion.  Warmgloblog believes the President missed an important opportunity on March 30 to teach and lead the nation in developing a coherent energy policy for the future.  In November, Secretary of Energy Steven Chu spoke of the present era, with respect to developing renewable energy sources, as a new “Sputnik moment”. It is hoped that future actions can remedy the present patchwork approach, leading to a comprehensive, funded plan to move the U.S. to a renewable energy economy.

© 2011 Henry Auer

Tuesday, February 15, 2011

The Regional Greenhouse Gas Initiative of the New England and Mid-Atlantic States

Summary:  The Regional Greenhouse Gas Initiative, including the six New England states and four Mid-Atlantic states, is the oldest greenhouse gas reduction regime in the U. S, using a cap-and-trade mechanism. Greenhouse gases are responsible for global warming occurring in recent decades.  It is also the most modest, affecting only emissions originating from electric power plants.  Since it began operating in 2009, it has collected large sums of money and has led to the creation of many new jobs and businesses.  While this modest beginning is praiseworthy, it is important to strive toward major, significant reductions in greenhouse gases, so that the increased level of greenhouse gases in the atmosphere can be stabilized.  

Introduction:  In recent years three regional initiatives have been set in place in the U. S. The Western Climate Initiative, formalized in February 2007; the Midwestern Greenhouse Gas Reduction Accord, set in place in November 2007; and the Regional Greenhouse Gas Initiative (RGGI), established in July 2007.  RGGI is discussed in this post.  The three regional accords encompass 23 states in the U. S. as well as several Canadian provinces.  Additional states and provinces are “observers” of the various accords.

The American states participating in these three agreements, and their greenhouse gas emissions, are shown in the following map:


Map displaying the three regional greenhouse gas emission reduction programs in the U. S. (omitting Canadian provinces in WCI and the Midwest Group as well as their contributions to emissions).  WCI: Western Climate Initiative; Midwest Group: the Accord; RGGI: Regional Greenhouse Gas Initiative.  MtCO2e: Millions of metric tonnes of greenhouse gas emissions expressed in terms of carbon dioxide-equivalent greenhouse activity.  Percents are the portions of total U. S. emissions.  

RGGI incorporates the ten states of Maine, New Hampshire, Vermont, Rhode Island Massachusetts, Connecticut, New York, New Jersey, Delaware, and Maryland.  The notion of setting up this regime began with Gov. George Pataki of New York.  In 2003, he wrote the governors of 11 other states in the Northeast proposing to limit greenhouse gas emissions.  He recognized the success of cap-and-trade in combating the sulfur emissions from Midwest power plants that cause acid rain, and identified under the U. S. Clean Air Act.  

RGGI was formalized in July 2007 by the establishment of the nonprofit corporation RGGI, Inc., whose role is to coordinate and oversee the administration of the Initiative.  As with the other two accords, it is up to the individual states to enact the enabling laws for operation of the Initiative in the respective states.  A Memorandum of Understanding (MOU) among the member states was initially issued in December 2005 by seven of the ten states.  The remaining three joined by early 2007.  As such, RGGI is the first of the three regional greenhouse gas accords currently operating in the U. S.

The MOU recognizes that global warming due to man-made greenhouse gases is occurring, and that the resulting increase in average global temperature has negative effects on the states involved, including more severe droughts and floods, changes in forest composition, and increasingly damaging storm surges along the coast.  It also recognizes that reducing the need for imported fossil fuels will enhance energy security and will lead to development of new industries related to renewable and sustainable energy sources.

Contrary to the WCI and MGGRA which cover all major activities that produce greenhouse gases, the RGGI accord agreed on controls only for fossil fuels used in electric power generation, affecting facilities with greater than 25 megawatts (MW) generating capacity.  It covers 209 facilities across the region.  The member states agreed to create a CO2 Budget Trading Program within the region, with the goal of stabilizing and then reducing the overall emissions from this source.  Each state’s base emission amount was established at the outset, totaling 188 million tons of CO2, and is to remain fixed at that level from 2009 through 2014.  The emissions limits are implemented by selling emission allowances, where 1 allowance covers 1 ton of CO2 emissions.  Starting in 2015, the allowances for each state are to be reduced by 2.5% per year, so that by 2018 the emissions will be 10% below the starting level.  The Trading Program is in fact a cap-and-trade regime, in which the allowances are tradable in an auction market.  The auctions occur quarterly.  They ensure fair pricing of the right to emit greenhouse gases on an open market available to all parties.  RGGI estimates that the auction price increases the cost of electricity to the consumer by only 0.4% to 1%.

The MOU also allows for offsets that serve as substitutes for actual reductions of CO2 emissions from a particular source.  Instead of achieving reductions in emissions at an emitting site, the source may use a limited part of its CO2 allowances to purchase offsets from remote facilities that accomplish reductions of emissions or new increases in CO2 removal from activities such as afforestation.  Initially the offset facilities must be within the region covered by the Initiative, but can be expanded to be anywhere in North America.  Allowances granted are biased to favor using offsets within the region.

Each RGGI state uses two thirds of the proceeds from the sale of allowances to promote activities that contribute to further reduction in greenhouse gas emissions.  These include subsidizing energy conservation activities and promoting renewable energy industries.

The RGGI model presents itself as serving as an example for a) a functioning cap-and-trade regime, b) a program that will reduce greenhouse gas emissions from fossil fuels, and c) identifying and promoting new ventures developing renewable energy sources and conservation.   As the oldest regional accord in the U. S., RGGI should serve as an example for the other regional greenhouse gas reduction accords, as well as for any federal regime that may emerge directed toward reducing greenhouse gas emissions.

Political Environment and Practical Results.  RGGI is the first regional initiative in the U. S. set in place to combat greenhouse gas emissions that cause global warming; as noted, it uses a cap-and-trade system to achieve its objectives.  Political supporters of such programs point out that the revenues received from allowances should be considerable, and will support development of new businesses and creation of new jobs.  Enterprises involved in energy conservation, and the development and installation of renewable energy sources, benefit from investment of these public funds in their activities.  Opponents of such programs, and especially cap-and-trade regimes, point out that consumers wind up paying the extra costs to cover the expense of buying allowances.  This extra expense, they argue, inhibits job growth and enterprise creation, leading to exporting jobs elsewhere.

These considerations, and others, have led to the failure to impose greenhouse gas restrictions at the federal level in the U. S.  It is reported, however, that as of December 2010 RGGI has been a success in most of the states covered by RGGI.  Nine auctions have been held, garnering $729 million.  The auctions have proceeded without problems, contrary to the early experiences of the European Union’s Emission Trading Scheme.  In New York, for example, every dollar spent promoting renewable energy spawns six dollars of overall new economic activity.  RGGI states have created hundreds to thousands of new jobs from these funds.  This modest success in RGGI (based on power plant sources only) suggests that the two other, newer, greenhouse gas initiatives, WCI and MGGRA, should also have positive effects.

Unfortunately, positive revenue balances in government accounts are always susceptible to attack.  In the present economic environment in which most U. S. states have severe budgetary deficits, such reservoirs look very attractive.  It is reported that Gov. Chris Christie of New Jersey has diverted $65 million from RGGI revenues for general expenditures.  In Connecticut former Gov. Jodi Rell likewise diverted ratepayer funds for the energy Efficiency Fund; currently some may be restored (email from Clean Water Action). 

RGGI Leads the Way toward Stabilizing the World’s Atmospheric CO2 “Bathtub”.  The modest reductions in the emissions of greenhouse gases under RGGI are first steps toward achieving a leveling off of the atmospheric CO2 concentration.  Much more needs to be done, however. The global atmosphere, and its CO2 component, can be thought of as a "bathtub", having a "faucet" that adds new CO2, and a "drain" that removes CO2.  The present amount of CO2, about 390 parts per million (ppm), is already higher than in the past several thousand years, and the highest since the start of the industrial revolution.  The”faucet”, including increased burning of fossil fuels worldwide, is adding about 2 ppm CO2 each year; the “bathtub” is getting fuller.  (There are fewer balancing activities that “drain” CO2 and other greenhouse gases from the atmospheric “bathtub”.)  The stronger greenhouse effect from this CO2 leads to higher overall, long-term, global temperatures, which are also higher than in the past. 

Thus it is imperative not merely to reduce the rate of adding new greenhouse gases to the atmospheric “bathtub”, but rather to achieve zero world-wide emissions as soon as practically possible

References:

RGGI CO2 Allowance Tracking System http://www.rggi.org/docs/RGGI_COATS_in_Brief.pdf


© 2011 Henry Auer