See the Tabbed Pages for links to video tutorials, and a linked list of post titles grouped by topic.

This blog is expressly directed to readers who do not have strong training or backgrounds in science, with the intent of helping them grasp the underpinnings of this important issue. I'm going to present an ongoing series of posts that will develop various aspects of the science of global warming, its causes and possible methods for minimizing its advance and overcoming at least partially its detrimental effects.

Each post will begin with a capsule summary. It will then proceed with captioned sections to amplify and justify the statements and conclusions of the summary. I'll present images and tables where helpful to develop a point, since "a picture is worth a thousand words".

Showing posts with label heavy rain. Show all posts

Tuesday, August 29, 2017

Extreme Rainfall with Flooding in the U. S. South

Summary.  Two extreme rainfall events with catastrophic flooding occurred in the U. S. recently.  The first was in the Baton Rouge, Louisiana, area in August 2016, and the second is ongoing at this writing in August 2017 in southeastern Texas including Houston.

Attribution of extreme events to global warming has become more reliable as a result of increased capabilities built into the statistical procedures employed in such analyses.  Global warming likely contributed about 20% to the rainfall experienced in the Baton Rouge flooding event of 2016. 

Global warming is now recognized to be due largely to emissions of greenhouse gases by humans.  It is projected to grow worse in coming decades if stringent efforts are not made to reduce these emissions.  In that case it is foreseen that extreme weather events may become more frequent and more severe.

 
Introduction.  The southern United States has suffered two episodes of unprecedented rainfall and flooding in the past year.  In August 2016 Baton Rouge, Louisiana and the surrounding area experienced torrential rain and rapid, extreme flooding beginning August 11 and extending beyond August 16.  Major damage and human dislocations resulted from this catastrophe.

In 2017 Hurricane Harvey left the Gulf of Mexico and made landfall near Corpus Christi, Texas on August 25.  Contrary to the paths of many hurricanes, Harvey degenerated into a tropical depression and stalled over southern Texas for days; as of this writing on August 29 it has drifted slowly to the northeast, hovering over Houston, Texas.  At various locations it has drenched the land with 20-40 inches (50-100 cm) of rain over this time (accessed August 29, 2017), causing extreme flooding, especially in the Houston area.  It is projected to continue northeastward toward Louisiana in the next day or more.

Flooding in Baton Rouge arose as an unusual weather pattern leading to excessive rainy conditions slowed considerably over the region for several days .  In the most severe case rain fell at a rate of 2–3 inches (5.1–7.6 cm) per hour, and produced a total of 24 inches (61 cm) of rainfall, with a maximum recorded as 31.4 inches (79.7 cm) in Watson, Louisiana.  The National Weather Service estimated the likelihood of such an event as 0.1%.  Flooding of eight rivers in the area led to major disruptions and damage, including damage to 146,000 homes, with tens of thousands of people relocated to emergency shelters.  About 265,000 children, or one-third of Louisiana’s school pupils, were prevented from attending school.  The economic impact has been estimated at between $10-$15 billion.

Rainfall and flooding in southern Texas is continuing at the time of this writing, and is expected to migrate east toward Louisiana in the coming days.  The amount of rainfall to date is extremely high; an interactive display of rainfall rates and total accumulated rainfall at various locations is available online (based on the National Weather Service; accessed August 29, 2017).  As of this writing, the total for the Corpus Christi area is 20 inches (50 cm), with a maximum rate of almost 3 inches per hour (7.5 cm per hour) on August 26.  The Houston area is far more seriously affected, according to the interactive map.  One location northeast of Houston shows a total rainfall to date of 52 inches (130 cm) with a maximum rate of about 10 inches per hour (25 cm per hour).  (The normal annual rainfall in Houston  is 49.8 inches (126 cm).  Images and videos of the flooding, its damage and human tragedy can be seen currently on news sources and the internet.  The economic impacts will certainly be extremely high.

Reports such as the Fourth National Climate Assessment draft (NCA) foresee worsening catastrophes such as those described here.   The draft NCA was prepared by climate scientists and related specialists drawn from thirteen U. S. government departments and agencies, as well as a large number of scientists in nongovernmental research facilities. They critically assessed peer-reviewed research and similar public sources, including primary datasets and widely-recognized climate modeling frameworks.  These standards assure that the findings of the report are objectively accurate, avoiding bias toward any unsubstantiated point of view.  By law the NCA cannot make any policy recommendations.

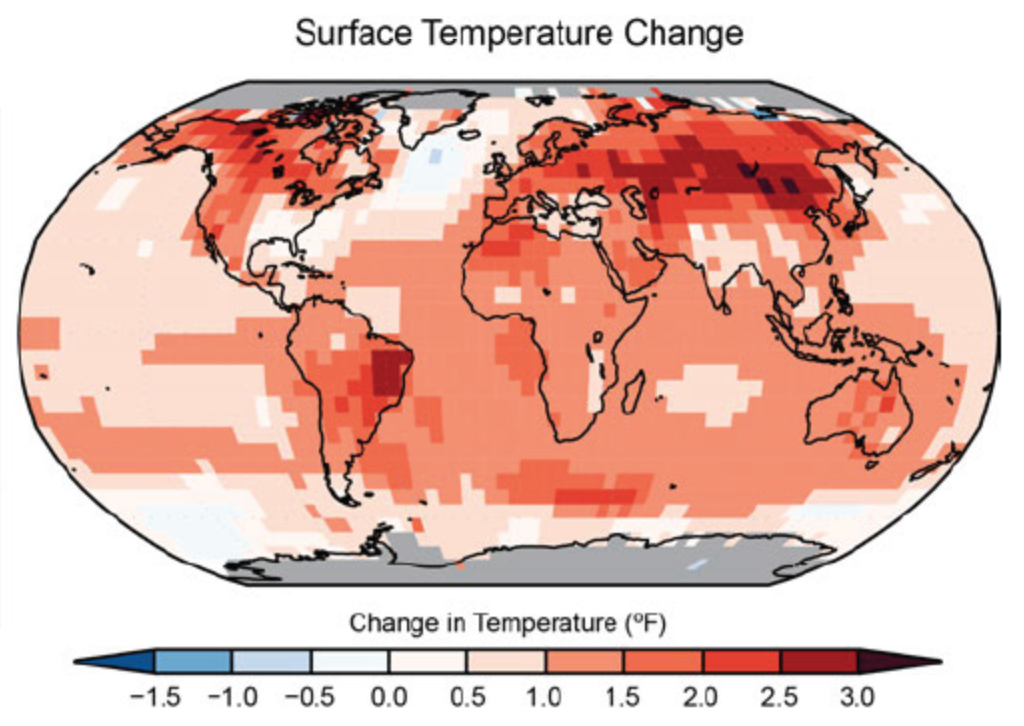
Among its conclusions, the NCA finds it is “extremely likely” that activities by humans have been the “dominant” cause of the warming observed since the middle of the 20th century.  It states with “very high confidence” that no alternatives, such as cyclical changes in solar energy reaching the Earth or variations in natural planetary factors, can explain the observed climate changes.

The NCA projects with “high confidence” that heavy precipitation events will continue increasing over the 21st century.  As noted, these trends are attributed to human activity.  They will likely worsen considerably as the climate warms.

Global warming contributes to the severity of extreme weather events.  Of the excess heat retained by the earth, i.e., the land, air and sea, as a result of man-made global warming, 90% enters the waters of the ocean.  The U. S. National Oceanographic and Atmospheric Administration finds that the sea surface temperature of the Gulf of Mexico in the early months of 2017 exceeded the 35-year average for 1981-2016 by about 0.75°C (1.3°F), and about equaled the record for that period.  Since the amount of water vapor that air can hold increases by about 7% per °C (about 4% per °F), the warmer Gulf surface temperature increased the water vapor capacity of the air by about 5% compared to earlier years. 

Since the complete weather system defined as hurricane/depression Harvey is spending a large fraction of its time over the Gulf, it recharges its moisture content continuously, indefinitely.  Over land, much of this added moisture in the system falls as additional amounts of rain, compared to earlier years.  Similar considerations hold for the Baton Rouge extreme event of 2016.  The physical damage and human harm inflicted by such calamities is costly.  Ultimately much of the burden becomes added expenditures imposed as taxes on the population at large.

Conclusion

Attribution of specific events to the general finding that global temperatures are rising has become far more reliable in recent years.  The procedures use advanced statistical measures to assess whether the extent by which the extreme event exceeds historical records has explanations other than global warming.  If not, a proportion of the overall extreme event may be attributed to the excess effect provided by global warming.

Since the Houston extreme rainfall and flooding event is still in progress, it is too early to attempt attribution of its causes.  The Baton Rouge event, however, has been assessed by attribution methods.  Wang and coworkers identified atmospheric weather patterns that promoted the catastrophic rainfall of this episode.  Regional model simulations lead to an estimate that global warming since 1985 likely increased the observed rainfall by 20%.   

Authoritative analyses of the earth’s climate show that the warming experienced to date is primarily due to man-made additions of greenhouse gases to the atmosphere.  This enhances retention of heat within the earth system rather than radiating excess heat to space.  Continued human activity that produces more greenhouse gases in the future is expected to worsen this effect, according to climate models, leading to excessive warming of the planet’s air, land and oceans.  In such a case, one consequence is expected to be more severe, and more frequent, extreme weather events such as the Baton Rouge intense rain and flooding, and hurricane/tropical depression Harvey currently wreaking havoc in Texas and Louisiana. 

Stringent reductions in further emissions of greenhouse gases are called for in order to lessen the impact of future extreme weather events. 
© 2016 Henry Auer

Tuesday, August 15, 2017

The Earth Continues Warming: The Fourth National Climate Assessment Draft Report

Summary


A draft of the Fourth National Climate Assessment reports that the global average temperature for the 30-year period from 1986 to 2016 rose by 1.2°F (0.7°C). It is extremely likely that activities by humans have been the principal cause of this warming. Extreme temperature and rainfall events have increased over this time, as have forest wildfires.
 

Arctic land-based ice has been lost to melting, and the extent and thickness of sea ice has decreased.  The mean sea level has risen about 7-8 in (about 26-21 cm) since 1900.  Ocean waters have taken up 93% of the excess heat of the Earth system due to global warming since the 1950s.
 
Global greenhouse gas emissions are projected to continue and consequently global temperatures will continue increasing and related trends will continue.  Limits to the intended increase require that humanity reduce annual emissions to zero by 2100. 
 
The draft states “Choices made today will determine the magnitude of climate change risks beyond the next few decades.”

The Fourth National Climate Assessment (NCA) is due in 2018 (See Background at the end of this post).  However the U.S. Global Change Research Program (USGCRP), which oversees preparation of the NCA, has prepared a Final Draft of a Climate Science Special Report (CSSR; see Note 1 at the end of the post) that has become publicly available as a freestanding document on which the actual NCA will be based.
 
This post is based on the CSSR Executive Summary (ES).  Confidence levels and likelihoods given here in italics are taken directly from the ES.  They are carefully defined in the CSSR.  Phrases in quotes are taken verbatim from the CSSR text.

The Historical Record

The global average temperature has risen above the average for the six decades 1901-1960 by 1.2°F (0.7°C) for the recent period from 1986 to 2016 (very high confidence). The map below shows temperature increases gridded across the globe.

Color-coded global map grid of historical changes in the average temperature for the period 1986-2016 relative to the average from the six-decade reference period 1901-1960, in °F. No data are available at the poles, indicated by gray.
Source: CSSR; https://www.nytimes.com/interactive/2017/08/07/climate/document-Draft-of-the-Climate-Science-Special-Report.html.


The map shows that since the reference decades the entire surface of the planet, both land and sea, has increased in regional average temperature.  The greatest increase has occurred in Canada (especially in the northern and Arctic regions), Alaska, Siberia, northeastern China and eastern Brazil. Indeed, the Arctic is warming about twice as fast as the global average.
It is extremely likely that activities by humans have been the “dominant” cause of the warming observed since the middle of the 20th century.  No alternatives, such as the cyclical changes in solar energy reaching the Earth or variations in natural planetary factors, can explain the observed climate changes (very high confidence).

Extreme climate-related weather events have increased in number and severity.  Since 1980 the cost of such calamities in the U. S. is over US$1 trillion. Extreme events can impact water quality, agriculture, human health, infrastructure, and lead to disaster events.  In the U. S. the number of high temperature records in the past 20 years is much higher than the number of low temperature records (very high confidence).

Heavy precipitation events in most regions of the U. S. have increased in intensity and frequency since 1901, especially in the northeast. (high confidence). 
The occurrence of large forest wildfires has increased in the U. S. West and Alaska since the early 1980s (high confidence). 

The waters of the oceans have absorbed about 93% of the heat accumulating in the Earth system due to global warming since the 1950s (very high confidence).  This affects climate patterns around the world.

In the Arctic, ice sheets overlaying land have been melting for at least the last three decades; in some locations the rate of loss is accelerating (very high confidence).    The rate of melting of ice sheets over Greenland has accelerated in the last few years (high confidence).  As this ice melts the water flows to the ocean, resulting in a net increase of sea level.

Arctic sea ice has been imaged since satellite flights permitted. The sea ice floats on the Arctic Ocean; its area expands and contracts in freeze-thaw seasonal cycles without any net change to global sea levels.  Rather, the extent responds to changes in air and sea temperatures.  The least extent, i.e., the most melting, occurs typically in September.  Striking images showing the loss of September sea ice from 1984 to 2016, both in thickness (color coded white as having been formed at least four years earlier) and in overall surface area, are shown in the images below:

Satellite images of Arctic sea ice extent and thickness in September, for 1984 (top) and 2016 (bottom).  The color bar shows the local age of the ice in years, a proxy for its thickness, from recent (dark gray) to more than 4 years (white).
Source: Adapted from CSSR; https://www.nytimes.com/interactive/2017/08/07/climate/document-Draft-of-the-Climate-Science-Special-Report.html.

 
Sea ice thickness has decreased by between 4.3 and 7.5 feet.  September sea ice extent has decreased by 10.7% to 15.9% per decade (very high confidence).  These changes reflect warming of the Arctic region over this time frame.  It is virtually certain that human activity has contributed to Arctic surface temperature increases, sea ice loss, glacier mass loss and snow extent decline seen across the Arctic (very high confidence).
The mean sea level has risen about 7-8 in (about 26-21 cm) since 1900 (very high confidence).  This is attributed “substantially” to human-induced climate change (high confidence).  The rate of sea level rise is greater than any found in the last 2,800 years (medium confidence).

Ocean waters are absorbing more than 25% of the carbon dioxide emitted into the atmosphere by burning fossil fuels.  Carbon dioxide is weakly acidic when dissolved in water, increasing its acidity (very high confidence).  This negatively impacts marine ecosystems in many important ways.

Projected Future Climate Trends
 
Extreme climate-related weather events will continue for many decades.
By the end of the 21st century if the world generates significant reductions in greenhouse gases the global average temperature increase could be limited to 3.6°F (2.0°C) or less. This would require a pathway of annual GHG emissions reaching near zero by then.  In contrast, minimal constraints on the annual emissions rate could result in a rise of 5.8-11.9°F (3.2-6.6°C) (high confidence).

Even if the annual rate of greenhouse gas (GHG) emissions were to fall to zero, the high burden of GHGs already accumulated in the atmosphere would persist for a long time.  The CSSR foresees that even in this event the global average temperature would rise further (high confidence), perhaps by an additional 1.1°F (0.6°C) (medium confidence).
But realistic projections all foresee continued GHG emissions into the future.  U. S. temperatures will continue to rise (very high confidence); new records for high temperatures will be frequent (virtually certain).  Temperatures by the end of this century will be much higher than the present (high confidence).
Heavy precipitation events are projected to continue increasing over the 21st century (high confidence).  In the western U. S., large reductions in mountain snowpack, and more precipitation falling as rain rather than snow, are projected as the climate warms (high confidence). These trends are attributed to human activity (high confidence).  They will likely worsen considerably as the climate warms (very high confidence).  In the absence of reductions in emission rates long-duration hydrological drought, due to decreased retention of soil moisture, becomes more likely by the end of the century (very high confidence).

Further warming is projected to lead to increases in wildfires (medium confidence).
 
If GHG emission rates continue unconstrained, the average sea surface temperature is projected to increase about 4.9°F (about 2.7°C) by 2100 (very high confidence).

The mean sea level will continue increasing, to varying extents depending on future emission rates, by at least 1 ft (30 cm; very high confidence) and as much as 4 ft (130 cm; low confidence) by 2100.  If the Antarctic ice shelf is lost due to high emission rates the upper bound could be as high as 8 ft (260 cm).  It is extremely likely that sea level will continue rising beyond 2100 (high confidence) as ice continues melting.
Further loss in Arctic sea ice will continue throughout the 21st century, very likely resulting in a virtually ice-free ocean by the 2040s (very high confidence).

Conclusions of the CSSR
 
Limiting the total global average temperature increase to 3.6°F (2.0°C), or less, from a 19th century baseline will require significant constraints on future GHG emission rates. Even though annual emission rates decreased slightly in 2014 and 2015, they are still too high to meet commitments that nations made upon entering the 2015 Paris Agreement (high confidence).  Indeed, present and projected emission rates would bring the atmospheric level of GHGs to levels so high that they have not occurred for at least the last 50 million years (medium confidence).

New carbon dioxide released “today” is long-lived, persisting in the atmosphere for decades to thousands of years. Therefore it’s important to note that the relationship between total atmospheric CO2 concentration and the increase in global temperature is a linear one. 

The ES states “Choices made today will determine the magnitude of climate change risks beyond the next few decades.  Stabilizing global mean temperature below 3.6°F (2°C) or lower relative to preindustrial levels requires significant reductions in …CO2 emissions…before 2040 and likely requires net emissions to become zero….”  If humanity continues emitting GHGs at rates higher than called for here we would reach the 3.6°F limit only two decades from now, with further temperature increases later.
Finally, changes that are unanticipated or difficult or impossible to manage, may arise during the next century.  Examples are complex (or simultaneously occurring) phenomena, and self-reinforcing changes (positive feedbacks).  Such occurrences would accelerate the world’s changes to points beyond the accepted CO2 temperature limits.

Analysis

Issuance of this NCA is mandated by an act of Congress.  It is important that this Final Draft, the CSSR, continue on its bureaucratic trajectory and be issued on schedule in 2018.  Yet some of the scientists contributing to the Draft hold positions in departments or agencies whose heads have expressed disdain or opposition to the phenomenon of global warming, the Paris Climate Agreement, have acted to reverse federal policies that limit extraction and use of fossil fuels, or have deleted pages concerning global warming from their agency’s websites.  They all work in an administration whose head has declared global warming to be a hoax. These situations potentially place the contributing scientists in conflicting positions.  Their work is commendable and should be supported.  The NCA should be issued without being altered, nor should it be suppressed.


[Update August 17, 2017: The science journal Nature has published a news article that discusses the CSSR and the political considerations facing the U. S. administration as it weighs issuing the Fourth NCA. Climate scientists are concerned about the fate of the Report. Nature notes that the Heartland Institute, a conservative think tank that promotes skepticism about global warming, is consulting with the Environmental Protection Agency on this issue.]
 
This NCA is only the latest in a long series of reports detailing the reality of warming and specifying the harms that global warming and climate change cause to our planet.  In particular, it attributes the cause to human activity, including the burning of fossil fuels. 

We must all undertake to reduce emissions of GHGs in our personal lives, and support policies promoting reductions at the state, national and international levels.
 
Background

The U. S. Global Change Research Act of 1990 mandates preparation of assessments of global change every four years to “assist the nation and the world to understand, assess, predict, and respond to human-induced and natural processes of global change”.  It assesses the current state of scientific understanding of global change on the natural and human environments. Its tasks, however, do not include formulation of policies to address global warming.
Climate scientists and related specialists drawn from thirteen U. S. government departments and agencies (see Note 2 at the end of this post), as well as a large number of scientists in nongovernmental research facilities, prepared the CSSR and the NCA. They critically assessed peer-reviewed research and similar public sources, including primary datasets and recognized climate modeling frameworks.

 
Notes

1.    USGCRP, 2017: Climate Science Special Report: A Sustained Assessment Activity of the U.S. Global Change Research Program [Wuebbles, D.J., D.W. Fahey, K.A. Hibbard, D.J. Dokken, B.C. Stewart, and T.K. Maycock (eds.)]. U.S. Global Change Research Program, Washington, DC, USA, 669 pp.
 
2.    The federal scientists involved in preparing the NCA and the CSSR are drawn from the:  

Department of Agriculture,
Department of Commerce (National Oceanic and Atmospheric Administration),
Department of Defense,
Department of Energy,
Department of Health and Human Services,
Department of the Interior,
Department of State,
Department of Transportation,
Environmental Protection Agency,
National Aeronautics and Space Administration,
National Science Foundation,
Smithsonian Institution, and
U.S. Agency for International Development.      

© 20
17 Henry Auer

Friday, April 7, 2017

The Centennial Celebration of the Paris Agreement Arrives 99 Years Early

Early in 2016, shortly after the United Nations-sponsored meeting that culminated in the Paris Climate Agreement of 2015, this writer posted a fable characterizing a fictional centennial commemoration of the 2015 Agreement in a scenario in which use of fossil fuels had continued unabated during that 100-year interval.  The fable is reproduced below:

The Centennial Commemoration of the 2015 Paris Climate Agreement

A Fable

It was December 2115, the hundredth anniversary of the agreement to a climate treaty reached among all the members of the United Nations, in Paris.  The members of the Petrex extended family gathered to mark the occasion.  By that time, three to four generations after the event, the clan had grown considerably, and had established for itself a fully self-sufficient environment inside its terradome.  For the occasion the space was opulently fitted out with an artificial lake in which were moored several model oil rigs.  The pipe linking the rigs to shore ended in an internally illuminated fountain gurgling champagne.  Scattered about the artificially-turfed land areas were several working model oil wells erected in mud fields of black caviar, pumping dark chocolate and coffee liqueurs, and other reminders of the black gold that had started the Petrex fortune, more than one hundred years earlier.

Back then, the clan founder, Malvolio Petrex, chairman and chief executive officer of the largest oil company at the time, had come to realize the inconsistencies of his, and his company’s, position.  They were, at one and the same time, using all their financial power and political influence to perpetuate, indeed to expand, the use of the oil they extracted from the ground, while correctly realizing that their exploitative activities were worsening the global warming already well under way.  After all, the Paris agreement itself was reached in response to expert scientific findings, reported for at least the preceding twenty years, that burning oil and other fossil fuels, such as those his company and others were pulling from the ground, added irreversibly to the atmospheric burden of carbon dioxide, a powerful greenhouse gas.

Malvolio Petrex knew that global warming was going to get much worse in the coming years, because his company and others were continuing to produce fossil fuels at ever-increasing rates of growth, year after year.  After all, more and more energy was needed to fuel the demands of economies all over the world, being used to expand their economies and raise the poorest peoples of the world out of poverty. 

He wasn’t too worried about his own welfare, though.  Thanks to his immeasurable wealth, he already had peppered several secure estates around the world, in various climatic and ecological settings.  But as any other dynastic figure that we may encounter throughout history, he was concerned about the wellbeing of his progeny.  He knew that the travesties his business activities were creating would worsen after he was gone, impacting the lives and indeed the safety of his scions.  He understood that worsening warming would lead to economic and political unrest among the impoverished and others less well off than he because they would be suffering the harmful effects of warming: flooding in some regions; droughts, wildfires and famine in others; and inexorable sea level rise driving millions around the world from their traditional homes and livelihoods.

And so he embarked on a program to develop self-contained environments for himself and his family.  The environments would insulate his family from the unpleasantness of dealing with the effects of climate change by keeping the open atmosphere out, and the family’s living quarters and areas for amusing themselves in.  The first models were installed on the grounds of his existing estates, and were relatively modest. 

Now, one hundred years later, after many rounds of development and improvement, this Petrex estate was enveloped in its own protective terradome.  It was a large, fully enclosed environment covering almost one square mile, incorporating the estate’s mansion, its recreational areas, and fields producing much of its food needs.  The terradome insulated the estate from the worst “weird” climate and weather events brought on by the extreme warming that the world had attained by then, as well as keeping a portion of the sun’s warming light from penetrating to the land within it.  The Petrex family had practically no need to travel outside the terradome; it was almost entirely self-sufficient.

As a result, they were insulated as well from the harms and damages induced by the warmer climate that most of the peoples of the world were suffering.  Or maybe they knew and, just like Malvolio Petrex a hundred years earlier, chose to ignore it.  The population at large was subjected to far worse conditions than Petrex’s world had experienced one hundred years earlier: debilitating heat waves and droughts, intense storms bringing on severe flooding, encroaching oceans because of the severe degree of sea level rise, all brought on by the excess global warming that burning fossil fuels induced. 

By the time of the centennial anniversary the opportunity for effective action to combat global warming had long passed.

 
                                          *         *         *        


The fabled centennial celebration of the Paris Agreement has already arrived, 99 years early.  The newly elected U. S. President, Donald Trump, is a man whose wealth could well serve as a model for the patriarch Malvolio Petrex.  He shows his wealth at least partly by erecting palatial residences and developing exclusive golf courses around the globe. 

Mr. Trump has called global warming a hoax.  Now as president he is implementing policies and appointing people to important cabinet positions who share his sentiment.  From the outset, he is reversing important initiatives undertaken by his predecessor, who had set in motion important policies that curb emissions of greenhouse gases.   

Here is a partial list of President Trump’s actions and policy positions:

·        He appointed Scott Pruitt to be Administrator of the Environmental Protection Agency (EPA). Instead of having an interest in protecting the environment, Mr. Pruitt is eliminating rules that preserve our natural world.  In his previous position as the Attorney General of Oklahoma, he repeatedly sued the EPA seeking to overturn its regulations that protect aspects of our environment, including emissions of greenhouse gases. Now he is the Administrator of that selfsame agency.  The Los Angeles Times writes “The Republican dogma of unrestrained economic exploitation drives the president and his EPA chief. As a result, climate science has become a heretical activity.”

·        Among fossil fuels coal emits the most carbon dioxide (per amount of heat obtained) when burned.  So its use should be limited as much as possible in order to reduce emissions.  But Secretary of the Interior Ryan Zinke ordered that a ban on mining coal on federal lands, put in place by former President Obama, be rescinded.  The order followed through on President Trump’s overall goal of increasing American energy independence.

·        PresidentTrump ordered a review of all policies deemed to interfere with enhancing America’s energy independence.  This includes directing Administrator Pruitt to reconsider the Clean Power Plan, an EPA regulation issued under President Obama that would produce significant reductions in carbon dioxide emissions from the electric power industry.

·        President Trump issued an order to review the program, issued by EPA and the Department of Transportation under President Obama, significantly increasing automobile Corporate Average Fuel Economy (CAFE) standards by 2025.  The review may lead to weakening the requirements or slowing the timeline for the CAFE regulation.

·        The budget proposal that President Trump outlined for Fiscal Year 2018 seriously cuts scientific research in many agencies of the U.S. government.  Concerning  activities related to curbing global warming, the proposal completely eliminates the Department of Energy’s Advance Research Projects Agency-Energy unit, reduces research support for the National Oceanographic and Atmospheric Administration by 52%, and cuts EPA research by 48% and National Aeronautics and Space Administration earth science research by 6%.  These agencies engage in essential research on the state of the planet’s climate and provide seed or venture funding for development of new technologies that lower greenhouse gas emissions.

President Trump, could easily serve as a model for Malvolio Petrex, since he can insulate himself from the ravages of intensified global warming.  His policies, to be implemented 99 years before the centennial of the Paris Climate Agreement, will have major immediate effects and indirect ramifications that worsen greenhouse gas emissions and lead to more severe harmful consequences of warming.  Yet we may imagine that, with the vast resources he controls, his children, grandchildren and further progeny can create environments for themselves that will protect them from harms and damages that global warming brings.  The same can be said for those he selected to implement his policies. 

But the peoples of the earth, considered at large, are not so lucky.  They can’t easily shield themselves from climatic harm.  They could well be defenseless victims of President Trump’s policies.  The climate framework that Mr. Trump is overthrowing, begun under President Obama and implemented worldwide with his leadership, could make significant progress to minimizing those risks. 

It’s not too late for the Trump Administration to reconsider, and rejoin the compact of the world’s nations to lower greenhouse gas emissions. 

      © 2017 Henry Auer

Friday, March 4, 2016

The Centennial Commemoration of the 2015 Paris Climate Agreement. II.

A Fable

Paris is sparing no extravagance for the centennial celebration of the 2015 climate agreement, themed “Paris 2115”.  The Eiffel Tower is decked out with the newest efficient lighting fixtures, highlighting the sky blue of the United Nations flag, intermingled with the Tricouleur, the red, white and blue of the French flag.  Laser light shows projecting these colors playfully pierce the air around its spire.

The Étoile and Arc de Triomphe are adorned with exotic vegetation brought from far reaches of the planet, symbols of the preservation of the environment resulting from one hundred years of sustainable climate policies resulting from the agreement.

The most striking aspect of the celebration is that several hundred thousand people from all around the world have descended on The City of Light, to mark the centennial of the United Nations Framework Convention on Climate Change (UNFCCC) agreement limiting emissions of greenhouse gases.  The 2015 agreement enshrined the goal of keeping the increase in global average temperature to under 2ºC (3.6ºF) above the preindustrial temperature, i.e., the temperature before humans began burning fossil fuels.  The agreement also included the more stringent goal of keeping the rise below 1.5ºC as a more ambitious option. 

Just under 200 nations, all the U.N.’s members, joined the agreement.  Now the member nations are celebrating, for they had in fact summoned their resources and achieved the more stringent goal.  This required that restraint and discipline be applied by each nation, each independently of, but in concert with, the constraints developed by every other nation.  The 2015 agreement made these constraints voluntary, nation by nation.  It is remarkable that the member nations all accepted the responsibility of fulfilling their pledges, with records and validation open for all to see.  Indeed, since the original 2015 pledges were deemed inadequate to attain this goal, the nations repeatedly reconvened every five years, and intensified their efforts by developing ever more stringent reduction pledges.  The centennial we are now celebrating honors these pledge extensions.  Without these extra efforts we could not have kept the global temperature from increasing as little as it has today.

How did this come about?  After all, the energy needed for industrialization and raising living standards in developing countries, obtained almost entirely from burning fossil fuels, had underpinned their headlong rush to economic growth for more than a century.  The fossil fuel industry was a significant fraction of the world economy, and the fuel companies exerted their considerable political power to maintain the status quo, extracting ever more fossil fuels each year.  This path, called “business-as-usual”, would have brought the world to an average temperature rise of about 4ºC, a truly devastating result.

Governments the world over, working in collaboration with the fossil fuel companies and other segments of the economy, transformed the world’s energy sector.  Governments and company managements, realizing the dangers of continuing along a business-as-usual path, transformed their political frameworks and business models.  The companies came to realize that there was profit to be gained by developing and deploying renewable energy sources, and redirected their development budgets accordingly.  New research and great economies of scale made solar and wind energy, for example, economical yet highly profitable.  Energy storage was optimized with new battery compositions and physical storage modes.  People began to see new beauty in renewable energy installations.  In the meanwhile, biotechnology researchers developed genetically modified crop plants that withstand the stresses of heat and drought more effectively than the old wild strains.  Research ingenuity also optimized yields of biofuels to provide all the needs of the growing airline industry.

Our land transportation has also been revolutionized.  Self-driving vehicles now navigate e-highways, minimizing the need for extra weight to protect us from crashes.  They are powered by newly developed highly efficient renewable energy sources.

Sadly, several small island nations that signed on to the agreement in 2015 no longer exist, because their islands were swallowed up by rising seas over the intervening one hundred years.  Already by 2015 sea level had been rising because, averaged over the seasons of the year, more ice melted from polar ice masses into the ocean than was deposited by fresh snow and ice.  Rising seas were already locked in by then.  Indeed, by 2015 ice loss had been accelerating because temperatures over the ice masses were rising rapidly.  Now as we fete the centennial, many coastal regions around the world have been lost to ocean inundation.

Pingali, Richard and Hailong met each other last night at the Korean pavilion.  Paris 2115 is organized around these centers, representing each nation of the UNFCCC agreement, all around the city.  Each one displays highlights of the environmental and sustainability contributions they have made in the past hundred years that brought us to this week’s celebration.  The three new friends are circulating among the pavilions, trying to take in as many as they can, from countries large and small. 

The celebration reaches its peak tomorrow, as major personalities from the UNFCCC and various nations speak about the significance of this occasion, and the way forward.  Of course these speeches will be streamed live as holographic displays in all the pavilions, so that all the celebrants can experience the immediacy of the presentations.
 

                                      *        *        *        *

 
The Paris Agreement reached in December 2015 represents major progress on the path to controlling worldwide emissions of greenhouse gases.  All 197 U. N. member nations agreed to its terms.  This accomplishment is due in large part to departure from earlier attempts at negotiating a treaty involving imposing predetermined limits on emissions from each nation.  Instead the Paris Agreement solicits voluntary pledges from each which, once filed, are subject to review and verification by the U. N. 

Prior to the convening of the Paris meeting almost all nations had already submitted their pledges.  A scientific evaluation shows that those pledges are insufficiently ambitious to achieve the goal of keeping the global average temperature increase less than 2ºC during this century.  Climate model calculations by  Fawcett and coworkers (Science, 2015, Vol. 350, pp. 1168-1169) show that the current voluntary pledges will keep the annual


Actual (up to 2010) and projected annual rates of emission of CO2 from energy and major industrial sources from 1990 to 2100.  The heavy lines are summary representations for four emissions scenarios.  Top to bottom these are the reference case of no emissions reduction policy in place; no reduction policy up to 2030, then a 2% per year reduction in emissions; implementation of only the current voluntary pledges through 2030, continued unchanged to 2100 (curve labeled INDCs); and the current voluntary pledges to 2030, then further reduction by at least 5% per year to 2100.  The individual thin lines are actual modeling runs repeated many times.  IPCC, Intergovernmental Panel on Climate Change; AR5, Fifth Assessment Report issued 2013-4.
Source: Fawcett and coworkers, Science, 2015, Vol. 350, pp. 1168-1169; http://science.sciencemag.org/content/sci/350/6265/1168.full.pdf .


rate of CO2 emissions level at their present rates up to 2100 (curve labeled INDCs in the graphic above).  Since these are annual rates, the emissions will continue to raise the total accumulated CO2 level throughout this period, leading to a steady rise in global average temperature to 2100.  Only the lowest heavy blue curve shows a decreased rate of annual emissions after 2030, accomplished in the model by imposing a stringent reduction in annual emissions rate of 5% per year.  The accumulation of CO2 in the atmosphere continues, admittedly at lower rates, throughout this period.  As a result the global average temperature will still continue rising from its present (unprecedented high) value at a slow but measurable pace.

The Paris negotiators recognized this deficiency, and included the intention in the Agreement to reconvene in five years to assess progress and to encourage updated pledges including more ambitious emission reductions from the member nations.  It also mentions explicitly the more stringent goal that reductions should in fact be ambitious enough to keep the increase in global average temperature below 1.5ºC.

Some nations and provinces around the world have already undertaken efforts to lower greenhouse gas emissions. China’s pledge lays out increasing annual emissions until 2030, mainly from burning coal, then a reduction in that rate.  But the recent economic slowdown in that country appears already to be leading to lower emissions than anticipated.  As part of its pledge, China intends to expand pilot cap-and-trade limits on emissions in some of its cities to the nation as a whole.

Australia imposed a carbon pricing scheme in 2012, but it was repealed in 2014.  In addition Australia is now severely cutting back its spending on its respected government scientific research organization, including its climate science section.  This impedes the country’s and the world’s ability to track its greenhouse gases and temperatures.

The European Commission announced a plan in 2010 to reduce emissions by 80% below 1990 levels by 2050.  Europe implemented a cap-and-trade Emissions Trading Scheme (ETS) a decade ago as part of its participation in the Kyoto Protocol, the UNFCCC agreement preceding the Paris Agreement.  The ETS has had difficulties that are preventing it from achieving its full potential.

The U.S. federal government has been unable to enact laws to limit emissions because the majority party in one or both of the Congress’s chambers does not admit the need to address man-made global warming.  But President Obama has undertaken executive steps that will double fuel efficiency of the nation’s vehicles, and will increase the efficiency of electricity generation in electricity generation.  Independently, California and some other states have policies limiting emissions similar to the reduction intended by the European Commission.

In Canada, the province of British Columbia has had a revenue-neutral carbon tax in place since 2008.  Revenues collected from the tax are used to lower tax rates in other categories.  Use of fossil fuels has dropped with no effect on the province’s economy.

 
Conclusion

 
Implementation of the Paris Agreement of 2015 promises to turn our world from a warming disaster to a manageable, but palpably warmer, global environment.  But there are powerful political and commercial interests opposing the changes needed to stabilize the global climate.  Business models of large multinational energy companies need to change, such that they recognize that profits can be derived from producing renewable energy.  Deep-rooted psychological barriers also exist that resist our need to change our ways.  With good will and ambitious planning the fable represented by Paris 2115 may come to pass.
 
© 2015 Henry Auer