See the Tabbed Pages for links to video tutorials, and a linked list of post titles grouped by topic.

This blog is expressly directed to readers who do not have strong training or backgrounds in science, with the intent of helping them grasp the underpinnings of this important issue. I'm going to present an ongoing series of posts that will develop various aspects of the science of global warming, its causes and possible methods for minimizing its advance and overcoming at least partially its detrimental effects.

Each post will begin with a capsule summary. It will then proceed with captioned sections to amplify and justify the statements and conclusions of the summary. I'll present images and tables where helpful to develop a point, since "a picture is worth a thousand words".

Showing posts with label floods. Show all posts

Thursday, October 7, 2021

What, Again? Global Warming Continues Unabated

Summary: This series of posts tabulates important findings from the six Assessment Reports (ARs) that the United Nations Intergovernmental Panel on Climate Change (IPCC) has released since 1990.  The previous post, “What, Again? Greenhouse Gases Accumulate in the Atmosphere", summarizing the six ARs, presents past greenhouse gas (GHG) emission rates, discusses future emission scenarios and proposes principles to minimize further emissions to keep accumulated GHG levels to as low a level as possible.

This post presents the direct consequences of rising GHG emissions: the increase in global average temperatures and its consequences, as foreseen in differing emission scenarios over the three decades that ARs have been issued.  Extreme weather and climate leads to significant economic and social harms and damages.  A final post will deal specifically with the effects of warming on our water environment: extremes of precipitation or its failure, melting ice domains and rising seas.

Some may feel this series repeats refrains, looping like broken records; such people may suffer from “climate fatigue”.  Humanity, however, has not responded to the worsening climate documented in the AR series. The critical, dire climate projections summarized in these posts should provide powerful incentives to take meaningful action at this time.

      *         *         *         *     *

The United Nations Intergovernmental Panel on Climate Change (IPCC) released the first of three volumes of its Sixth Assessment Report (AR6) in August 2021.  ARs have been issued at intervals of 6-7 years since 1990. They document the history of the annual rate of global emissions of the principal GHGs, arising from human activity, and of the total amount of GHGs accumulated in the atmosphere since the industrial revolution (Ind. Rev.) began.  Using climate models and a range of scenarios of GHG emission rates they present projections for each scenario of future climate characteristics and effects to the end of this century.  They also discuss general goals (but not specific policies) for limiting future emission rates.

The results and projections presented in ARs 1-6 are broadly consistent with each other across the AR series, but have greater specificity and stronger assessments of likelihood as the series progresses.  They record the profound increase, due to human activity, of accumulated atmospheric GHGs, especially carbon dioxide (CO2), across the years.  Most GHGs do not dissipate in the atmosphere; they continue accumulating to higher levels as long as their annual emission rates continue.  It’s as if a tub fills higher and higher with water (representing GHGs), as long as the faucet is open.  When the emissions (the faucet) are turned off, the level in the tub doesn’t get lower; the water/GHG content stays at the level accumulated up to that time.  Being greenhouse gases, they retain more and more heat as their level increases.  The result is that global average temperatures continue rising, causing damaging extreme events the world over.

The graphic below shows the coupled relationship between atmospheric CO2 levels from 1880 to 2019 and corresponding yearly global average temperatures.  The correlation


Overlaid graphs of atmospheric CO2 concentration in parts per million (ppm; orange line, orange numerical scale on the right vertical axis) and yearly values of the global average temperature in °C (white line, white numerical scale on the left vertical axis; for corresponding °F multiply by x1.8).  Temperature values shown are the deviations from the 30-year average temperature from 1881-1910. Source: Climate Central https://www.climatecentral.org/ using data from the National Aeronautics and Space Administration Goddard Institute for Space Studies (NASA GISS), National Oceanic and Atmospheric Administration National Centers for  Environmental Information (NOAA NCEI), and NOAA Earth System Research Laboratories (ESRL).


is remarkable.  Elsewhere in the ARs (but not included in this series of posts) the IPCC has shown that it is only due to the CO2 and other GHGs that have been added to the Earth system from human actions that the global temperature has risen as shown in the graphic, and not because of any other potential factor. 

The topics selected for this post, tabulated below in the Details section, are Past Temperature Rise, Projected Further Rise in Global Average Temperature, and Projected Warming Patterns.  As seen in the table, the authors of AR1 recognized already in 1990 that because of the accumulation GHGs the Earth system was warming (Column 2).  The global average temperature has continued rising, by 2021 (AR6) reaching 1.07°C (2.06°F) above the 1850-1900 average value, early in the Ind. Rev.

In future decades the temperature is projected to continue increasing (Column 3), depending on the emission scenario, from stringent to relaxed annual emission rates.  In AR6, compared to 1850-1900 (early in the Ind. Rev.), stringent emission scenarios project 1.0-1.8°C (1.8-3.2°F) warming by 2100, whereas the relaxed scenario projects 3.3-5.7°C (5.9-10.3°F) warming. Finally, the need to reduce annual emissions was recognized beginning with AR1 and reiterated, with increasing urgency, throughout the series. Current goals are to keep warming to 1.5°C (2.7°F; optimal) or 2°C (3.6°F; acceptable) above pre-industrial values (AR6). Higher global temperatures are projected (Column 4) to lead to extreme weather and climate events, many of which we are already experiencing around the globe.

Whereas the need to reduce emissions is expressed in AR1 and extends up to the present in AR6, the strength of climate science underpinning those conclusions has increased dramatically over time.  The capabilities of gathering data and using more powerful computers to analyze them, and to develop more refined, detailed climate models have all increased dramatically.  (Incidentally the Nobel Prize in Physics, awarded October 5, 2021, recognized the development of early climate models.  These have served as the foundation for today’s highly refined models.)

Recent ARs reflect this enhancement.  For example the current first volume of AR6 was compiled by 234 climate scientists chosen from among all the nations of the IPCC.  They reviewed over 14,000 research articles published since AR5.  Drafts of the chapters in AR6 were reviewed by other scientists as well as by national governments.  We can feel assured that the final text represents scientific and political consensus views.

Conclusion

In the table shown in the Details section Column 4, “Projected Warming Patterns”, summarizes the increasing urgency of acting to reduce annual emission rates to near zero as the AR series progresses.  AR2 as long ago as 1995 foresaw some regions of the Earth having more severe floods or droughts while others would be less affected.  There would be more extremely hot days and fewer extremely cold days. The forecasts in AR4 in 2007 are made with higher confidence than in AR3.   AR6 in 2021 foresees continued warming with worse hot extremes and droughts in some areas.

Indeed, actual extreme weather and climate events have become the subjects of frequent current headlines, documenting heat waves and droughts, famine, uncontrolled wildfires, intense precipitation events and flooding, and melting of glaciers and ice sheets leading to sea level rise, documenting effects that were only predicted in the early ARs.  Also, by AR6 the science of attribution of extreme climate events has progressed dramatically, and permits ascribing the severity, if not the actual occurrence or not, of events to the effects of global warming.

Early action could have been taken at moderate levels of effort and expense to avert future, if not yet apparent, hazards such as described in Columns 3 and 4 of the table.  Such opportunities were not seized.  By 2021 such hazardous events are now current, requiring immediate action.  Necessarily these current actions must be far more aggressive, pervasive and costly in order to deal with a warming Earth approaching criticality.  They also require fundamental and comprehensive changes in social and cultural approaches to adapt to the consequences of warming.

Unequivocally we must encourage our political, corporate and civic leaders to embark on bold, comprehensive actions without further delay.

Details

This writer collated the entries in the following table from either the Summary for Policymakers, a “Headline” document or a press release, all issued by the IPCC in conjunction with each AR.  The entries are necessarily selective rather than comprehensive, and have been edited for brevity.

EVALUATIONS OF GLOBAL WARMING AND TEMPERATURE IN IPCC ASSESSMENT REPORTS


© 2021 Henry Auer

Thursday, January 24, 2019

Former Vice President Biden Says Climate Change Is An “Existential” Threat

Former U. S. Vice President Joe Biden spoke before the United States Conference of Mayors on January 24, 2019.  Following the link above takes you to the YouTube video of his address.  Fully half of his 30-minute speech was devoted to the dire need for the U. S. to address climate change rather than retreat from the issue the way the present Trump administration is doing. 

Vice President Biden summarized the important climate and economic benefits generated by the funds in the Obama administration’s Recovery Act of 2009 (intended to stimulate the economy out of the Great Recession) that were directed to mitigating climate change in the U. S.  He then proceeded to offer a heartfelt, sincere and cogent statement on why and how U. S. federal policy should continue to combat climate change by doubling down on policies that reduce greenhouse gas emissions and build a renewable energy economy.  By doing so the U. S. would rejoin all the other nations of the world in our unified campaign to limit further global warming, to which we all subscribed in the Paris Agreement of 2015.

The link above takes one to the video of Biden’s speech.  The portion dealing with climate change begins at about 16 min, 19 sec (16:19) of the video, and continues to about 29 min, near the end.  (For those unfamiliar with YouTube, if you mouse over any part of the video screen the timeline of the video pops up at the bottom of the screen.  Then as the mouse scans along that timeline, you can stop at 16:19 [or any other time you wish].  If you then click on that position the video will begin playing at that point.)

Here are some direct quotes from Biden’s talk, with the time for each statement indicated.

  • The Recovery Act included “the single biggest investment in clean energy in the history of the country - $90 billion.  It leveraged $150 billion in the private sector. [It] created hundreds of thousands of clean energy jobs…By the end of the administration there was 30 times as much solar energy and [we were] creating clean energy jobs 12 times faster than any other sector of the economy.” (16:19)
  • “There’s no reason that in 2025 all of North America can’t get half of electricity from non-polluting sources.  It’s within our grasp but for special interests!” (20:40)
  • Addressing the mayors directly, he said “You also know…it’s a matter of survival.  The threat posed by climate change is existential.” (21:26)
  • “You know what the military said [to President Obama and Vice President Biden]?  ‘You know what our greatest security threat is?  Global warming….If sea levels rise…you have tens of millions of people migrating.  That’s how wars start.’” (21:42)
  • “Our government’s own most recent report found that heat stress and drought can kill up to a quarter of our corn and soybean harvest.  What’s that going to mean for you mayors from the Midwest…? What does that mean … when John Deere [a major manufacturer of farm equipment] has nothing to plow? (23:40)
  • Our scientists have spoken…Since when did we become science deniers?  The United Nations told us…we have 12 years to act before it’s irreversible” (24:07)
  • (Referring to the Trump administration intention to pull out of the Paris Agreement)…“you’ve stepped up [addressing the mayors]….400 of you said, no, no, not me….57% of you pledged to take action in 2019”  (25:50)
  • “…this is the most urgent priority facing the nation, and we’ll be judged by our children and grandchildren for what we do today.” (27:48)    

  Conclusion

This writer finds it highly significant that Vice President Biden, in his appearance before the United States Conference of Mayors for 2019 devoted so much emphasis to the single issue of climate change.  With all the problems facing our mayors, such as economic and social injustice, and opioid abuse, to name only a few, he chose to stress the importance of the climate change issue as an “existential” threat, stating “this is the most urgent priority facing the nation”.

Skeptics may downplay this speech as being merely a political gesture from someone grappling with the decision of whether to run for president in two years.  Yet there are many other ways he could have addressed our country’s mayors.  Here’s a man who was at the center of national power for eight years.  He came to understand the singular, generational, global significance of man-made emissions of greenhouse gases that have led to intolerable levels of global warming in the short time, geologically speaking, of a figurative blink of an eye.  Mr. Biden is to be praised for this effort.  We all should support his call to action on climate change, regardless of whether he runs for president.

© 2019 Henry Auer

Tuesday, August 29, 2017

Extreme Rainfall with Flooding in the U. S. South

Summary.  Two extreme rainfall events with catastrophic flooding occurred in the U. S. recently.  The first was in the Baton Rouge, Louisiana, area in August 2016, and the second is ongoing at this writing in August 2017 in southeastern Texas including Houston.

Attribution of extreme events to global warming has become more reliable as a result of increased capabilities built into the statistical procedures employed in such analyses.  Global warming likely contributed about 20% to the rainfall experienced in the Baton Rouge flooding event of 2016. 

Global warming is now recognized to be due largely to emissions of greenhouse gases by humans.  It is projected to grow worse in coming decades if stringent efforts are not made to reduce these emissions.  In that case it is foreseen that extreme weather events may become more frequent and more severe.

 
Introduction.  The southern United States has suffered two episodes of unprecedented rainfall and flooding in the past year.  In August 2016 Baton Rouge, Louisiana and the surrounding area experienced torrential rain and rapid, extreme flooding beginning August 11 and extending beyond August 16.  Major damage and human dislocations resulted from this catastrophe.

In 2017 Hurricane Harvey left the Gulf of Mexico and made landfall near Corpus Christi, Texas on August 25.  Contrary to the paths of many hurricanes, Harvey degenerated into a tropical depression and stalled over southern Texas for days; as of this writing on August 29 it has drifted slowly to the northeast, hovering over Houston, Texas.  At various locations it has drenched the land with 20-40 inches (50-100 cm) of rain over this time (accessed August 29, 2017), causing extreme flooding, especially in the Houston area.  It is projected to continue northeastward toward Louisiana in the next day or more.

Flooding in Baton Rouge arose as an unusual weather pattern leading to excessive rainy conditions slowed considerably over the region for several days .  In the most severe case rain fell at a rate of 2–3 inches (5.1–7.6 cm) per hour, and produced a total of 24 inches (61 cm) of rainfall, with a maximum recorded as 31.4 inches (79.7 cm) in Watson, Louisiana.  The National Weather Service estimated the likelihood of such an event as 0.1%.  Flooding of eight rivers in the area led to major disruptions and damage, including damage to 146,000 homes, with tens of thousands of people relocated to emergency shelters.  About 265,000 children, or one-third of Louisiana’s school pupils, were prevented from attending school.  The economic impact has been estimated at between $10-$15 billion.

Rainfall and flooding in southern Texas is continuing at the time of this writing, and is expected to migrate east toward Louisiana in the coming days.  The amount of rainfall to date is extremely high; an interactive display of rainfall rates and total accumulated rainfall at various locations is available online (based on the National Weather Service; accessed August 29, 2017).  As of this writing, the total for the Corpus Christi area is 20 inches (50 cm), with a maximum rate of almost 3 inches per hour (7.5 cm per hour) on August 26.  The Houston area is far more seriously affected, according to the interactive map.  One location northeast of Houston shows a total rainfall to date of 52 inches (130 cm) with a maximum rate of about 10 inches per hour (25 cm per hour).  (The normal annual rainfall in Houston  is 49.8 inches (126 cm).  Images and videos of the flooding, its damage and human tragedy can be seen currently on news sources and the internet.  The economic impacts will certainly be extremely high.

Reports such as the Fourth National Climate Assessment draft (NCA) foresee worsening catastrophes such as those described here.   The draft NCA was prepared by climate scientists and related specialists drawn from thirteen U. S. government departments and agencies, as well as a large number of scientists in nongovernmental research facilities. They critically assessed peer-reviewed research and similar public sources, including primary datasets and widely-recognized climate modeling frameworks.  These standards assure that the findings of the report are objectively accurate, avoiding bias toward any unsubstantiated point of view.  By law the NCA cannot make any policy recommendations.

Among its conclusions, the NCA finds it is “extremely likely” that activities by humans have been the “dominant” cause of the warming observed since the middle of the 20th century.  It states with “very high confidence” that no alternatives, such as cyclical changes in solar energy reaching the Earth or variations in natural planetary factors, can explain the observed climate changes.

The NCA projects with “high confidence” that heavy precipitation events will continue increasing over the 21st century.  As noted, these trends are attributed to human activity.  They will likely worsen considerably as the climate warms.

Global warming contributes to the severity of extreme weather events.  Of the excess heat retained by the earth, i.e., the land, air and sea, as a result of man-made global warming, 90% enters the waters of the ocean.  The U. S. National Oceanographic and Atmospheric Administration finds that the sea surface temperature of the Gulf of Mexico in the early months of 2017 exceeded the 35-year average for 1981-2016 by about 0.75°C (1.3°F), and about equaled the record for that period.  Since the amount of water vapor that air can hold increases by about 7% per °C (about 4% per °F), the warmer Gulf surface temperature increased the water vapor capacity of the air by about 5% compared to earlier years. 

Since the complete weather system defined as hurricane/depression Harvey is spending a large fraction of its time over the Gulf, it recharges its moisture content continuously, indefinitely.  Over land, much of this added moisture in the system falls as additional amounts of rain, compared to earlier years.  Similar considerations hold for the Baton Rouge extreme event of 2016.  The physical damage and human harm inflicted by such calamities is costly.  Ultimately much of the burden becomes added expenditures imposed as taxes on the population at large.

Conclusion

Attribution of specific events to the general finding that global temperatures are rising has become far more reliable in recent years.  The procedures use advanced statistical measures to assess whether the extent by which the extreme event exceeds historical records has explanations other than global warming.  If not, a proportion of the overall extreme event may be attributed to the excess effect provided by global warming.

Since the Houston extreme rainfall and flooding event is still in progress, it is too early to attempt attribution of its causes.  The Baton Rouge event, however, has been assessed by attribution methods.  Wang and coworkers identified atmospheric weather patterns that promoted the catastrophic rainfall of this episode.  Regional model simulations lead to an estimate that global warming since 1985 likely increased the observed rainfall by 20%.   

Authoritative analyses of the earth’s climate show that the warming experienced to date is primarily due to man-made additions of greenhouse gases to the atmosphere.  This enhances retention of heat within the earth system rather than radiating excess heat to space.  Continued human activity that produces more greenhouse gases in the future is expected to worsen this effect, according to climate models, leading to excessive warming of the planet’s air, land and oceans.  In such a case, one consequence is expected to be more severe, and more frequent, extreme weather events such as the Baton Rouge intense rain and flooding, and hurricane/tropical depression Harvey currently wreaking havoc in Texas and Louisiana. 

Stringent reductions in further emissions of greenhouse gases are called for in order to lessen the impact of future extreme weather events. 
© 2016 Henry Auer

Tuesday, August 15, 2017

The Earth Continues Warming: The Fourth National Climate Assessment Draft Report

Summary


A draft of the Fourth National Climate Assessment reports that the global average temperature for the 30-year period from 1986 to 2016 rose by 1.2°F (0.7°C). It is extremely likely that activities by humans have been the principal cause of this warming. Extreme temperature and rainfall events have increased over this time, as have forest wildfires.
 

Arctic land-based ice has been lost to melting, and the extent and thickness of sea ice has decreased.  The mean sea level has risen about 7-8 in (about 26-21 cm) since 1900.  Ocean waters have taken up 93% of the excess heat of the Earth system due to global warming since the 1950s.
 
Global greenhouse gas emissions are projected to continue and consequently global temperatures will continue increasing and related trends will continue.  Limits to the intended increase require that humanity reduce annual emissions to zero by 2100. 
 
The draft states “Choices made today will determine the magnitude of climate change risks beyond the next few decades.”

The Fourth National Climate Assessment (NCA) is due in 2018 (See Background at the end of this post).  However the U.S. Global Change Research Program (USGCRP), which oversees preparation of the NCA, has prepared a Final Draft of a Climate Science Special Report (CSSR; see Note 1 at the end of the post) that has become publicly available as a freestanding document on which the actual NCA will be based.
 
This post is based on the CSSR Executive Summary (ES).  Confidence levels and likelihoods given here in italics are taken directly from the ES.  They are carefully defined in the CSSR.  Phrases in quotes are taken verbatim from the CSSR text.

The Historical Record

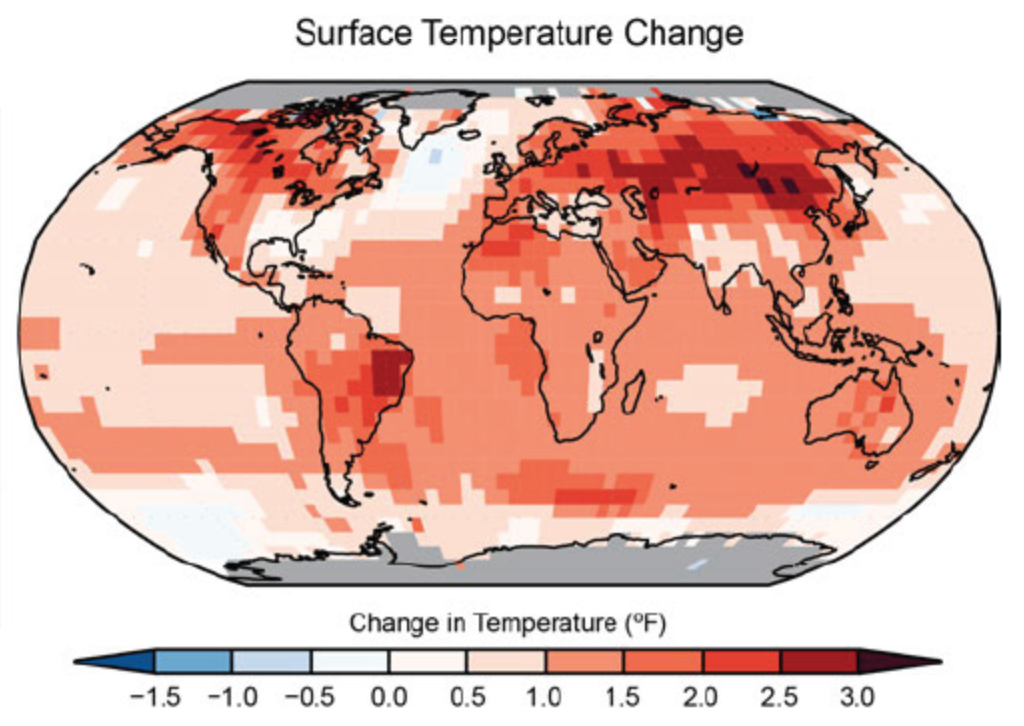
The global average temperature has risen above the average for the six decades 1901-1960 by 1.2°F (0.7°C) for the recent period from 1986 to 2016 (very high confidence). The map below shows temperature increases gridded across the globe.

Color-coded global map grid of historical changes in the average temperature for the period 1986-2016 relative to the average from the six-decade reference period 1901-1960, in °F. No data are available at the poles, indicated by gray.
Source: CSSR; https://www.nytimes.com/interactive/2017/08/07/climate/document-Draft-of-the-Climate-Science-Special-Report.html.


The map shows that since the reference decades the entire surface of the planet, both land and sea, has increased in regional average temperature.  The greatest increase has occurred in Canada (especially in the northern and Arctic regions), Alaska, Siberia, northeastern China and eastern Brazil. Indeed, the Arctic is warming about twice as fast as the global average.
It is extremely likely that activities by humans have been the “dominant” cause of the warming observed since the middle of the 20th century.  No alternatives, such as the cyclical changes in solar energy reaching the Earth or variations in natural planetary factors, can explain the observed climate changes (very high confidence).

Extreme climate-related weather events have increased in number and severity.  Since 1980 the cost of such calamities in the U. S. is over US$1 trillion. Extreme events can impact water quality, agriculture, human health, infrastructure, and lead to disaster events.  In the U. S. the number of high temperature records in the past 20 years is much higher than the number of low temperature records (very high confidence).

Heavy precipitation events in most regions of the U. S. have increased in intensity and frequency since 1901, especially in the northeast. (high confidence). 
The occurrence of large forest wildfires has increased in the U. S. West and Alaska since the early 1980s (high confidence). 

The waters of the oceans have absorbed about 93% of the heat accumulating in the Earth system due to global warming since the 1950s (very high confidence).  This affects climate patterns around the world.

In the Arctic, ice sheets overlaying land have been melting for at least the last three decades; in some locations the rate of loss is accelerating (very high confidence).    The rate of melting of ice sheets over Greenland has accelerated in the last few years (high confidence).  As this ice melts the water flows to the ocean, resulting in a net increase of sea level.

Arctic sea ice has been imaged since satellite flights permitted. The sea ice floats on the Arctic Ocean; its area expands and contracts in freeze-thaw seasonal cycles without any net change to global sea levels.  Rather, the extent responds to changes in air and sea temperatures.  The least extent, i.e., the most melting, occurs typically in September.  Striking images showing the loss of September sea ice from 1984 to 2016, both in thickness (color coded white as having been formed at least four years earlier) and in overall surface area, are shown in the images below:

Satellite images of Arctic sea ice extent and thickness in September, for 1984 (top) and 2016 (bottom).  The color bar shows the local age of the ice in years, a proxy for its thickness, from recent (dark gray) to more than 4 years (white).
Source: Adapted from CSSR; https://www.nytimes.com/interactive/2017/08/07/climate/document-Draft-of-the-Climate-Science-Special-Report.html.

 
Sea ice thickness has decreased by between 4.3 and 7.5 feet.  September sea ice extent has decreased by 10.7% to 15.9% per decade (very high confidence).  These changes reflect warming of the Arctic region over this time frame.  It is virtually certain that human activity has contributed to Arctic surface temperature increases, sea ice loss, glacier mass loss and snow extent decline seen across the Arctic (very high confidence).
The mean sea level has risen about 7-8 in (about 26-21 cm) since 1900 (very high confidence).  This is attributed “substantially” to human-induced climate change (high confidence).  The rate of sea level rise is greater than any found in the last 2,800 years (medium confidence).

Ocean waters are absorbing more than 25% of the carbon dioxide emitted into the atmosphere by burning fossil fuels.  Carbon dioxide is weakly acidic when dissolved in water, increasing its acidity (very high confidence).  This negatively impacts marine ecosystems in many important ways.

Projected Future Climate Trends
 
Extreme climate-related weather events will continue for many decades.
By the end of the 21st century if the world generates significant reductions in greenhouse gases the global average temperature increase could be limited to 3.6°F (2.0°C) or less. This would require a pathway of annual GHG emissions reaching near zero by then.  In contrast, minimal constraints on the annual emissions rate could result in a rise of 5.8-11.9°F (3.2-6.6°C) (high confidence).

Even if the annual rate of greenhouse gas (GHG) emissions were to fall to zero, the high burden of GHGs already accumulated in the atmosphere would persist for a long time.  The CSSR foresees that even in this event the global average temperature would rise further (high confidence), perhaps by an additional 1.1°F (0.6°C) (medium confidence).
But realistic projections all foresee continued GHG emissions into the future.  U. S. temperatures will continue to rise (very high confidence); new records for high temperatures will be frequent (virtually certain).  Temperatures by the end of this century will be much higher than the present (high confidence).
Heavy precipitation events are projected to continue increasing over the 21st century (high confidence).  In the western U. S., large reductions in mountain snowpack, and more precipitation falling as rain rather than snow, are projected as the climate warms (high confidence). These trends are attributed to human activity (high confidence).  They will likely worsen considerably as the climate warms (very high confidence).  In the absence of reductions in emission rates long-duration hydrological drought, due to decreased retention of soil moisture, becomes more likely by the end of the century (very high confidence).

Further warming is projected to lead to increases in wildfires (medium confidence).
 
If GHG emission rates continue unconstrained, the average sea surface temperature is projected to increase about 4.9°F (about 2.7°C) by 2100 (very high confidence).

The mean sea level will continue increasing, to varying extents depending on future emission rates, by at least 1 ft (30 cm; very high confidence) and as much as 4 ft (130 cm; low confidence) by 2100.  If the Antarctic ice shelf is lost due to high emission rates the upper bound could be as high as 8 ft (260 cm).  It is extremely likely that sea level will continue rising beyond 2100 (high confidence) as ice continues melting.
Further loss in Arctic sea ice will continue throughout the 21st century, very likely resulting in a virtually ice-free ocean by the 2040s (very high confidence).

Conclusions of the CSSR
 
Limiting the total global average temperature increase to 3.6°F (2.0°C), or less, from a 19th century baseline will require significant constraints on future GHG emission rates. Even though annual emission rates decreased slightly in 2014 and 2015, they are still too high to meet commitments that nations made upon entering the 2015 Paris Agreement (high confidence).  Indeed, present and projected emission rates would bring the atmospheric level of GHGs to levels so high that they have not occurred for at least the last 50 million years (medium confidence).

New carbon dioxide released “today” is long-lived, persisting in the atmosphere for decades to thousands of years. Therefore it’s important to note that the relationship between total atmospheric CO2 concentration and the increase in global temperature is a linear one. 

The ES states “Choices made today will determine the magnitude of climate change risks beyond the next few decades.  Stabilizing global mean temperature below 3.6°F (2°C) or lower relative to preindustrial levels requires significant reductions in …CO2 emissions…before 2040 and likely requires net emissions to become zero….”  If humanity continues emitting GHGs at rates higher than called for here we would reach the 3.6°F limit only two decades from now, with further temperature increases later.
Finally, changes that are unanticipated or difficult or impossible to manage, may arise during the next century.  Examples are complex (or simultaneously occurring) phenomena, and self-reinforcing changes (positive feedbacks).  Such occurrences would accelerate the world’s changes to points beyond the accepted CO2 temperature limits.

Analysis

Issuance of this NCA is mandated by an act of Congress.  It is important that this Final Draft, the CSSR, continue on its bureaucratic trajectory and be issued on schedule in 2018.  Yet some of the scientists contributing to the Draft hold positions in departments or agencies whose heads have expressed disdain or opposition to the phenomenon of global warming, the Paris Climate Agreement, have acted to reverse federal policies that limit extraction and use of fossil fuels, or have deleted pages concerning global warming from their agency’s websites.  They all work in an administration whose head has declared global warming to be a hoax. These situations potentially place the contributing scientists in conflicting positions.  Their work is commendable and should be supported.  The NCA should be issued without being altered, nor should it be suppressed.


[Update August 17, 2017: The science journal Nature has published a news article that discusses the CSSR and the political considerations facing the U. S. administration as it weighs issuing the Fourth NCA. Climate scientists are concerned about the fate of the Report. Nature notes that the Heartland Institute, a conservative think tank that promotes skepticism about global warming, is consulting with the Environmental Protection Agency on this issue.]
 
This NCA is only the latest in a long series of reports detailing the reality of warming and specifying the harms that global warming and climate change cause to our planet.  In particular, it attributes the cause to human activity, including the burning of fossil fuels. 

We must all undertake to reduce emissions of GHGs in our personal lives, and support policies promoting reductions at the state, national and international levels.
 
Background

The U. S. Global Change Research Act of 1990 mandates preparation of assessments of global change every four years to “assist the nation and the world to understand, assess, predict, and respond to human-induced and natural processes of global change”.  It assesses the current state of scientific understanding of global change on the natural and human environments. Its tasks, however, do not include formulation of policies to address global warming.
Climate scientists and related specialists drawn from thirteen U. S. government departments and agencies (see Note 2 at the end of this post), as well as a large number of scientists in nongovernmental research facilities, prepared the CSSR and the NCA. They critically assessed peer-reviewed research and similar public sources, including primary datasets and recognized climate modeling frameworks.

 
Notes

1.    USGCRP, 2017: Climate Science Special Report: A Sustained Assessment Activity of the U.S. Global Change Research Program [Wuebbles, D.J., D.W. Fahey, K.A. Hibbard, D.J. Dokken, B.C. Stewart, and T.K. Maycock (eds.)]. U.S. Global Change Research Program, Washington, DC, USA, 669 pp.
 
2.    The federal scientists involved in preparing the NCA and the CSSR are drawn from the:  

Department of Agriculture,
Department of Commerce (National Oceanic and Atmospheric Administration),
Department of Defense,
Department of Energy,
Department of Health and Human Services,
Department of the Interior,
Department of State,
Department of Transportation,
Environmental Protection Agency,
National Aeronautics and Space Administration,
National Science Foundation,
Smithsonian Institution, and
U.S. Agency for International Development.      

© 20
17 Henry Auer

Thursday, March 17, 2016

Attribution of Extreme Events to Global Warming


The public, when contemplating global warming, includes those who question whether warming underlies the occurrence of extreme weather and climate events.  The U.S. National Academies of Science, Engineering and Medicine recently issued a report, “Attribution of Extreme Weather Events in the Context of Climate Change”.  It emphasizes that the appropriate format for questions concerning this issue can be phrased in terms such as “Are events of this severity becoming more or less likely because of climate change?” 

The report emphasizes that because of rapid advances in data analysis and climate modeling the severity of many extreme events can be attributed to contributing factors arising from warming.  It includes a schematic image, shown here, characterizing how the increasing degree of understanding of various types of events leads to increasing confidence in the degree to which we can attribute severity to contributions from global warming.

This post concludes with a selection of examples from the climate literature where such analyses have been made, leading to affirmative statements of attribution such as considered here.


Recently weather news has reported on extreme events in many regions of the world. 

  • The American states of Texas and Louisiana, and their neighbors, had intense rain for over a week in early 2016, triggering record-breaking flooding in the area.    
  • The American West has suffered severe drought conditions for four years, straining water supplies and lowering yields of important crops. 
  • Perth, Australia had a heat wave four days long with temperatures over 40ºC (104ºF) in February 2016, and has had seven days over this temperature this season.  
  • Pakistan has had increasing numbers of serious flooding events over the last century, including 40 events in the last 15 years.  Most of these are accompanied by loss of life and social dislocation, and significant damage to structures and agricultural lands.
These few anecdotes are potentially significant indicators of the effect that global warming is having at regional and local levels around the world.  Indeed, increased rates of occurrence of such phenomena are predicted with high confidence in recent global warming reports.  But in discussing the role of warming at the scale of such geographically small areas it is important to evaluate whether each one in fact is related to warming.  For example, if few or none are, climate science would be hard pressed to persuade policymakers and the public to undertake efforts to minimize further warming and adapt to its effects.  On the other hand, if it can be shown that there is indeed a contribution from warming, then climate science is justified in actively pursuing appropriate policies such as those agreed to at the United Nations conference in Paris in December 2015.

Here we discuss the question of whether, and how, extreme events can be attributed to global warming.

The U. S. National Academies of Sciences, Engineering, and Medicine issued the report “Attribution of Extreme Weather Events in the Context of Climate Change” (2016); Washington, DC: The National Academies Press (the Report) on March 10, 2016.  The Report emphasizes that extreme events, just as all our weather every day, results from the interactions of many atmospheric forces and processes.  For this reason, it makes the very important point that we can not justifiably ask a question such as “Was this extreme event caused by [man-made] climate change, yes or no?”  Such a simplified black-or-white question overlooks the complexity in climate and weather. 

Rather the Report offers different questions phrased as “Are events of this severity becoming more or less likely because of climate change?”; or, for single events such as local storms, the question could be “To what extent was the storm intensified, or its precipitation increased, because of climate change?”  Note that the questions deemed appropriate seek expressions of likelihood, rather than the certainty demanded by the yes-or-no question.  To any viewer of a televised weather forecast this should hardly be surprising.  After all, these daily predictions always provide likelihoods for sunshine (clear, partly cloudy, mostly cloudy, etc.) as well as percent probabilities of rain, sleet or snow.  In the same way, and for the same reasons, the Report concludes that statements of attribution should be phrased in terms of the probability or likelihood that global warming was a climatic factor contributing to the occurrence of the extreme event.

The Report summarizes its detailed deliberations about attribution of events to known or understandable contributing factors with a simplified conceptual diagram, shown here
 
Schematic diagram showing how our confidence (vertical axis) in attributing different kinds of extreme events to man-made climate change depends on our understanding of the extent to which climate change affects the particular type of event (horizontal axis).  Different types of extreme events are shown by the differently colored labeled circles.  The dashed line represents where a particular type of extreme event would fall if we had an ideal ability to attribute how climate change affects it.  In reality all the circles fall below the dashed line because our ability to attribute the specific events to man-made climate change is less than perfect.  Note that the understanding/attribution level is high for temperature events (upper right), and that these become lower as we pass through extreme rainfall (near the center) to severe convective storms (e.g., thunderstorms and tornadoes; lower left).
Source: U. S. National Academies of Sciences, Engineering, and Medicine,  “Attribution of Extreme Weather Events in the Context of Climate Change” (2016); Washington, DC: The National Academies Press. doi: 10.17226/21852.
 
 
The Report identifies two ways to label an event as “extreme”.  We have to be able to distinguish a supposed extreme event, potentially caused in part by the effects of global warming, from normal behavior.  First, data characterizing the event could be shown to differ from comparable data for a reference period extending over a sufficiently long period of time, with a high level of statistical significance.  Alternatively, data characterizing the event could be successfully modeled in a climate model that includes man-made global warming factors, whereas it could not be modeled by a similar model run excluding those factors, again, with a high level of statistical significance.  An event that fulfils either of these conditions can then be labeled as an event to which global warming contributes to its extreme character.
 
Extreme events had already been attributed to global warming before this Report. 
 
  • Analysis of data over the 49 year period from 1951-1999 shows that global warming is responsible for extremes of rainfall over the Northern Hemisphere.  Min and coworkers (Nature, 2011, Vol. 470, pp. 378-381, doi:10.1038/nature09763) showed that “human-induced increases in greenhouse gases have contributed to the observed intensification of heavy precipitation events found over approximately two-thirds of … Northern Hemisphere land areas.”  This work is significant because it covers a period of time in which greenhouse gas levels, and global average temperatures, were much lower than at present.
 
  • Extreme rainfall and catastrophic flooding in England and Wales in 2000 was very likely due to human-induced global warming.  Pall and coworkers carried out a probabilistic analysis of weather patterns and likelihood of flooding in the region (Nature, 2011, Vol. 470, pp. 382-385, doi:10.1038/nature09762). During October and November 2000 England and Wales had the heaviest rainfall since records began in 1766, leading to severe flooding. The authors concluded “it is very likely that global [human-induced] greenhouse gas emissions [occurring during the twentieth century] substantially increased the risk of flood occurrence…in autumn 2000.”
 
  • Kelley and coworkers (Proc. Natl Acad. Sci., published online before print March 2, 2015) report on the worst drought in recorded history in Syria and neighboring countries just prior to the “Arab Spring”.  The drought was serious enough that large numbers of farmers left their villages and migrated to Syria’s cities.  This caused major social and political turmoil and is considered to be a contributing factor to Syria’s ongoing civil war.  The authors found that human-derived greenhouse gases contributed to the drought.
 
  • Moore and Lobell (Proc. Natl. Acad. Sci., vol. 112 no. 9, pp. 2670–2675, 2015) analyzed changes in crop yields and climate change across Europe between 1989 and 2009.  Large scale decreases in yields were found in many localized regions, which correlated with increased temperatures and decreased precipitation over the 20 year period studied.
 
  • Diffenbaugh and coworkers (Proc. Natl. Acad. Sci., published online before print March 2, 2015) examined the drought in California from December 2012 to September 2014, likely the worst in 1000 years.  By simulating the region’s climate in model calculations the authors found that the extra amount of greenhouse gases added by human activity likely resulted in higher temperatures and reduced precipitation in the region.  This factor also contributes to a high risk of continued severe droughts.
 
  • Williams and coworkers also conducted detailed analyses of climate-related data for California, from 1901 to 2014 (Geophys. Res. Let. 2015; DOI: 10.1002/2015GL064924).  From rigorous statistical analysis the authors estimated that global warming was responsible for 8-27% of the observed excess drought conditions for 2012-2014, and for 5-18% for 2014 alone.  These findings indicate that although drought conditions may originate from various climatic factors operating cyclically over many years, its full extreme extent in the current drought has been worsened by global warming, producing the current record conditions.
 
  • Cook and coworkers (Sci. Adv. 1, e1400082 (2015); published electronically 12 February 2015) assessed drought conditions in the American Southwest and Central Plains.  Assuming that unrestrained emission of greenhouse gases would continue, the risk of severe droughts in these regions is projected to be extremely high, by various measures between about 69% and 97% in the second half of this century.
 
Conclusion
 
The Report by the National Academies makes clear that climate science has advanced remarkably in the last decade, so that attributions of global warming as a contributing factor to extreme events can reliably be made after appropriate analysis.  This depends on use of one or both of the methods, either data based or model based, mentioned above.  The progress making this possible includes the availability of far more observational data, on the one hand, and constant improvements in climate models on the other.  As a result statements of attribution, when merited based on analysis, now authoritatively support the role of man-made global warming, due to humanity’s continued and increasing use of fossil fuels, in the increasing severity of various types of extreme climate and weather events.  We all, as citizens of countries around the world, must marshal our efforts to reduce emissions as aggressively as possible.  The goal should be achieving near zero annual emission rates within a few decades, say by mid-century.
 
© 2016 Henry Auer