See the Tabbed Pages for links to video tutorials, and a linked list of post titles grouped by topic.

This blog is expressly directed to readers who do not have strong training or backgrounds in science, with the intent of helping them grasp the underpinnings of this important issue. I'm going to present an ongoing series of posts that will develop various aspects of the science of global warming, its causes and possible methods for minimizing its advance and overcoming at least partially its detrimental effects.

Each post will begin with a capsule summary. It will then proceed with captioned sections to amplify and justify the statements and conclusions of the summary. I'll present images and tables where helpful to develop a point, since "a picture is worth a thousand words".

Showing posts with label sea level. Show all posts

Tuesday, August 15, 2017

The Earth Continues Warming: The Fourth National Climate Assessment Draft Report

Summary


A draft of the Fourth National Climate Assessment reports that the global average temperature for the 30-year period from 1986 to 2016 rose by 1.2°F (0.7°C). It is extremely likely that activities by humans have been the principal cause of this warming. Extreme temperature and rainfall events have increased over this time, as have forest wildfires.
 

Arctic land-based ice has been lost to melting, and the extent and thickness of sea ice has decreased.  The mean sea level has risen about 7-8 in (about 26-21 cm) since 1900.  Ocean waters have taken up 93% of the excess heat of the Earth system due to global warming since the 1950s.
 
Global greenhouse gas emissions are projected to continue and consequently global temperatures will continue increasing and related trends will continue.  Limits to the intended increase require that humanity reduce annual emissions to zero by 2100. 
 
The draft states “Choices made today will determine the magnitude of climate change risks beyond the next few decades.”

The Fourth National Climate Assessment (NCA) is due in 2018 (See Background at the end of this post).  However the U.S. Global Change Research Program (USGCRP), which oversees preparation of the NCA, has prepared a Final Draft of a Climate Science Special Report (CSSR; see Note 1 at the end of the post) that has become publicly available as a freestanding document on which the actual NCA will be based.
 
This post is based on the CSSR Executive Summary (ES).  Confidence levels and likelihoods given here in italics are taken directly from the ES.  They are carefully defined in the CSSR.  Phrases in quotes are taken verbatim from the CSSR text.

The Historical Record

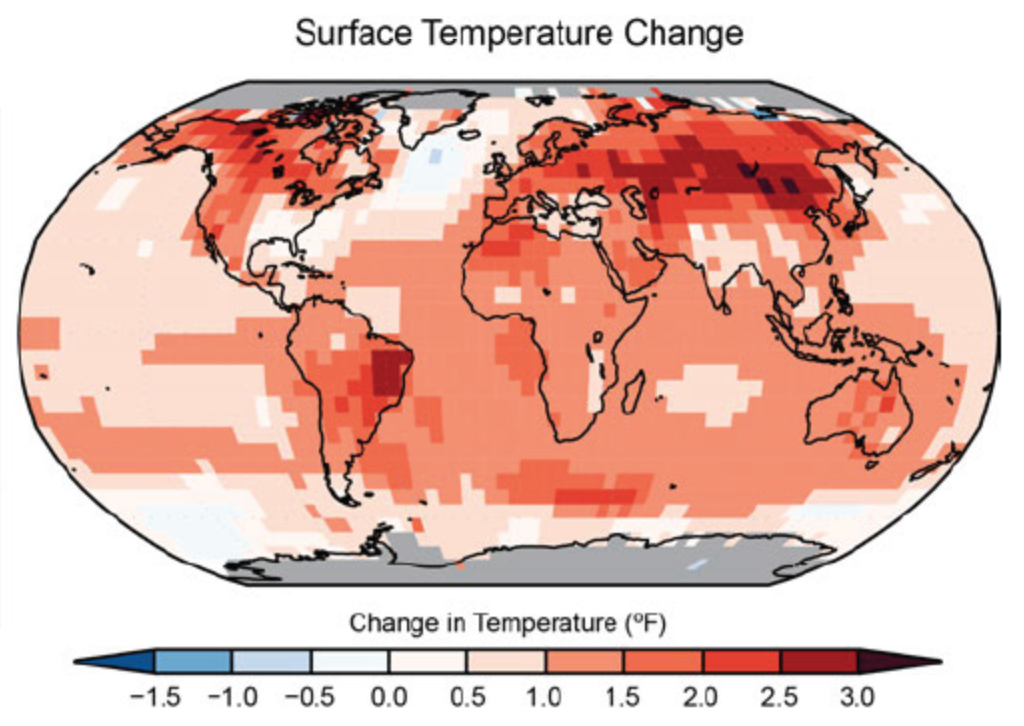
The global average temperature has risen above the average for the six decades 1901-1960 by 1.2°F (0.7°C) for the recent period from 1986 to 2016 (very high confidence). The map below shows temperature increases gridded across the globe.

Color-coded global map grid of historical changes in the average temperature for the period 1986-2016 relative to the average from the six-decade reference period 1901-1960, in °F. No data are available at the poles, indicated by gray.
Source: CSSR; https://www.nytimes.com/interactive/2017/08/07/climate/document-Draft-of-the-Climate-Science-Special-Report.html.


The map shows that since the reference decades the entire surface of the planet, both land and sea, has increased in regional average temperature.  The greatest increase has occurred in Canada (especially in the northern and Arctic regions), Alaska, Siberia, northeastern China and eastern Brazil. Indeed, the Arctic is warming about twice as fast as the global average.
It is extremely likely that activities by humans have been the “dominant” cause of the warming observed since the middle of the 20th century.  No alternatives, such as the cyclical changes in solar energy reaching the Earth or variations in natural planetary factors, can explain the observed climate changes (very high confidence).

Extreme climate-related weather events have increased in number and severity.  Since 1980 the cost of such calamities in the U. S. is over US$1 trillion. Extreme events can impact water quality, agriculture, human health, infrastructure, and lead to disaster events.  In the U. S. the number of high temperature records in the past 20 years is much higher than the number of low temperature records (very high confidence).

Heavy precipitation events in most regions of the U. S. have increased in intensity and frequency since 1901, especially in the northeast. (high confidence). 
The occurrence of large forest wildfires has increased in the U. S. West and Alaska since the early 1980s (high confidence). 

The waters of the oceans have absorbed about 93% of the heat accumulating in the Earth system due to global warming since the 1950s (very high confidence).  This affects climate patterns around the world.

In the Arctic, ice sheets overlaying land have been melting for at least the last three decades; in some locations the rate of loss is accelerating (very high confidence).    The rate of melting of ice sheets over Greenland has accelerated in the last few years (high confidence).  As this ice melts the water flows to the ocean, resulting in a net increase of sea level.

Arctic sea ice has been imaged since satellite flights permitted. The sea ice floats on the Arctic Ocean; its area expands and contracts in freeze-thaw seasonal cycles without any net change to global sea levels.  Rather, the extent responds to changes in air and sea temperatures.  The least extent, i.e., the most melting, occurs typically in September.  Striking images showing the loss of September sea ice from 1984 to 2016, both in thickness (color coded white as having been formed at least four years earlier) and in overall surface area, are shown in the images below:

Satellite images of Arctic sea ice extent and thickness in September, for 1984 (top) and 2016 (bottom).  The color bar shows the local age of the ice in years, a proxy for its thickness, from recent (dark gray) to more than 4 years (white).
Source: Adapted from CSSR; https://www.nytimes.com/interactive/2017/08/07/climate/document-Draft-of-the-Climate-Science-Special-Report.html.

 
Sea ice thickness has decreased by between 4.3 and 7.5 feet.  September sea ice extent has decreased by 10.7% to 15.9% per decade (very high confidence).  These changes reflect warming of the Arctic region over this time frame.  It is virtually certain that human activity has contributed to Arctic surface temperature increases, sea ice loss, glacier mass loss and snow extent decline seen across the Arctic (very high confidence).
The mean sea level has risen about 7-8 in (about 26-21 cm) since 1900 (very high confidence).  This is attributed “substantially” to human-induced climate change (high confidence).  The rate of sea level rise is greater than any found in the last 2,800 years (medium confidence).

Ocean waters are absorbing more than 25% of the carbon dioxide emitted into the atmosphere by burning fossil fuels.  Carbon dioxide is weakly acidic when dissolved in water, increasing its acidity (very high confidence).  This negatively impacts marine ecosystems in many important ways.

Projected Future Climate Trends
 
Extreme climate-related weather events will continue for many decades.
By the end of the 21st century if the world generates significant reductions in greenhouse gases the global average temperature increase could be limited to 3.6°F (2.0°C) or less. This would require a pathway of annual GHG emissions reaching near zero by then.  In contrast, minimal constraints on the annual emissions rate could result in a rise of 5.8-11.9°F (3.2-6.6°C) (high confidence).

Even if the annual rate of greenhouse gas (GHG) emissions were to fall to zero, the high burden of GHGs already accumulated in the atmosphere would persist for a long time.  The CSSR foresees that even in this event the global average temperature would rise further (high confidence), perhaps by an additional 1.1°F (0.6°C) (medium confidence).
But realistic projections all foresee continued GHG emissions into the future.  U. S. temperatures will continue to rise (very high confidence); new records for high temperatures will be frequent (virtually certain).  Temperatures by the end of this century will be much higher than the present (high confidence).
Heavy precipitation events are projected to continue increasing over the 21st century (high confidence).  In the western U. S., large reductions in mountain snowpack, and more precipitation falling as rain rather than snow, are projected as the climate warms (high confidence). These trends are attributed to human activity (high confidence).  They will likely worsen considerably as the climate warms (very high confidence).  In the absence of reductions in emission rates long-duration hydrological drought, due to decreased retention of soil moisture, becomes more likely by the end of the century (very high confidence).

Further warming is projected to lead to increases in wildfires (medium confidence).
 
If GHG emission rates continue unconstrained, the average sea surface temperature is projected to increase about 4.9°F (about 2.7°C) by 2100 (very high confidence).

The mean sea level will continue increasing, to varying extents depending on future emission rates, by at least 1 ft (30 cm; very high confidence) and as much as 4 ft (130 cm; low confidence) by 2100.  If the Antarctic ice shelf is lost due to high emission rates the upper bound could be as high as 8 ft (260 cm).  It is extremely likely that sea level will continue rising beyond 2100 (high confidence) as ice continues melting.
Further loss in Arctic sea ice will continue throughout the 21st century, very likely resulting in a virtually ice-free ocean by the 2040s (very high confidence).

Conclusions of the CSSR
 
Limiting the total global average temperature increase to 3.6°F (2.0°C), or less, from a 19th century baseline will require significant constraints on future GHG emission rates. Even though annual emission rates decreased slightly in 2014 and 2015, they are still too high to meet commitments that nations made upon entering the 2015 Paris Agreement (high confidence).  Indeed, present and projected emission rates would bring the atmospheric level of GHGs to levels so high that they have not occurred for at least the last 50 million years (medium confidence).

New carbon dioxide released “today” is long-lived, persisting in the atmosphere for decades to thousands of years. Therefore it’s important to note that the relationship between total atmospheric CO2 concentration and the increase in global temperature is a linear one. 

The ES states “Choices made today will determine the magnitude of climate change risks beyond the next few decades.  Stabilizing global mean temperature below 3.6°F (2°C) or lower relative to preindustrial levels requires significant reductions in …CO2 emissions…before 2040 and likely requires net emissions to become zero….”  If humanity continues emitting GHGs at rates higher than called for here we would reach the 3.6°F limit only two decades from now, with further temperature increases later.
Finally, changes that are unanticipated or difficult or impossible to manage, may arise during the next century.  Examples are complex (or simultaneously occurring) phenomena, and self-reinforcing changes (positive feedbacks).  Such occurrences would accelerate the world’s changes to points beyond the accepted CO2 temperature limits.

Analysis

Issuance of this NCA is mandated by an act of Congress.  It is important that this Final Draft, the CSSR, continue on its bureaucratic trajectory and be issued on schedule in 2018.  Yet some of the scientists contributing to the Draft hold positions in departments or agencies whose heads have expressed disdain or opposition to the phenomenon of global warming, the Paris Climate Agreement, have acted to reverse federal policies that limit extraction and use of fossil fuels, or have deleted pages concerning global warming from their agency’s websites.  They all work in an administration whose head has declared global warming to be a hoax. These situations potentially place the contributing scientists in conflicting positions.  Their work is commendable and should be supported.  The NCA should be issued without being altered, nor should it be suppressed.


[Update August 17, 2017: The science journal Nature has published a news article that discusses the CSSR and the political considerations facing the U. S. administration as it weighs issuing the Fourth NCA. Climate scientists are concerned about the fate of the Report. Nature notes that the Heartland Institute, a conservative think tank that promotes skepticism about global warming, is consulting with the Environmental Protection Agency on this issue.]
 
This NCA is only the latest in a long series of reports detailing the reality of warming and specifying the harms that global warming and climate change cause to our planet.  In particular, it attributes the cause to human activity, including the burning of fossil fuels. 

We must all undertake to reduce emissions of GHGs in our personal lives, and support policies promoting reductions at the state, national and international levels.
 
Background

The U. S. Global Change Research Act of 1990 mandates preparation of assessments of global change every four years to “assist the nation and the world to understand, assess, predict, and respond to human-induced and natural processes of global change”.  It assesses the current state of scientific understanding of global change on the natural and human environments. Its tasks, however, do not include formulation of policies to address global warming.
Climate scientists and related specialists drawn from thirteen U. S. government departments and agencies (see Note 2 at the end of this post), as well as a large number of scientists in nongovernmental research facilities, prepared the CSSR and the NCA. They critically assessed peer-reviewed research and similar public sources, including primary datasets and recognized climate modeling frameworks.

 
Notes

1.    USGCRP, 2017: Climate Science Special Report: A Sustained Assessment Activity of the U.S. Global Change Research Program [Wuebbles, D.J., D.W. Fahey, K.A. Hibbard, D.J. Dokken, B.C. Stewart, and T.K. Maycock (eds.)]. U.S. Global Change Research Program, Washington, DC, USA, 669 pp.
 
2.    The federal scientists involved in preparing the NCA and the CSSR are drawn from the:  

Department of Agriculture,
Department of Commerce (National Oceanic and Atmospheric Administration),
Department of Defense,
Department of Energy,
Department of Health and Human Services,
Department of the Interior,
Department of State,
Department of Transportation,
Environmental Protection Agency,
National Aeronautics and Space Administration,
National Science Foundation,
Smithsonian Institution, and
U.S. Agency for International Development.      

© 20
17 Henry Auer

Tuesday, December 4, 2012

Hurricane Sandy: Economic Costs and Global Warming


Summary.  Hurricane Sandy struck the state of New Jersey and the New York metropolitan area on Monday October 29, 2012.  It caused damage estimated to range as high as US$50 billion, much of it due to storm surges that impacted wide stretches of shoreline in New Jersey, the heart of New York City, and eastward along New York and Connecticut. 

The ravages of the storm could be due to factors related to global warming, such as increases in the moisture content of air over warm ocean waters, rising sea levels, and a blocking high pressure system that forced the path of the storm toward land.

Global warming is expected to worsen the impacts of extreme weather events such as Hurricane Sandy.  Society is faced with the prospect of having to remediate their effects as emergency situations each time one occurs.  Costs of such efforts affect us all, since they ultimately create a demand for higher taxes and for higher insurance premiums.  An alternative would be to undertake investments now to eliminate fossil fuels from our energy economy.  The sooner the world decarbonizes its energy usage, the smaller the accumulated level of atmospheric greenhouse gases will be, and the less harmful will be the effects of global warming on the people of the world.

 
Hurricane Sandy was an extensive and highly damaging storm that crossed from its ocean track onto land in New Jersey on Monday October 29, 2012.  Its characteristics, contributing to the high damage it caused, were the very large area it covered and the very high storm surge that it generated.  In addition, its winds, while not as high as those of other hurricanes, brought down many trees that severed electricity service, damaged homes, and even directly caused some deaths.

Why was Sandy destructive?  The climate science underlying the warming of the planet provides predictions, or scenarios, in terms of probabilities of trends occurring over long time periods and spanning wide regions of the planet.  Long term projections of future trends in the climate are not able to ascribe causes for short term weather events, such as hurricanes, with certainty.  In addition, not enough time has passed as of this writing for climate scientists to assess Hurricane Sandy in terms of its relationship to the warming of the planet.

Nevertheless, three factors from warming involved in hurricane activity include increased moisture content of air, higher sea level, and a weather block that caused the storm to shift its course.  First, as water temperatures get warmer, the absolute amount of water vapor that the air above it can hold increases by about 7% per ºC (about 4% per ºF) (for any temperature, this amount defines 100% on the scale of relative humidity).  As the ocean surface warms, a storm such as a hurricane picks up more water vapor which can be deposited as rain as the storm proceeds.

Second, sea levels have been rising since the industrial revolution began. Glaciers and land-based ice sheets have been melting, contributing new water to the oceans; this is attributed at least partly to global warming.  Also, water expands by about 0.026% per ºC at 25 ºC (0.015% per ºF at 77 ºF).  This expansion can proceed only upwards.  Although this percentage may seem insignificant, increased temperatures of ocean surface water penetrate to sufficient depths that expansion occurs throughout this layer.  This results in measurable increases in sea level as the earth warms.  The long-term rise in global average sea levels is shown below for the period 1870 to  2000.


Global average sea level trend from 1880 to 2000, referenced to a zero value given as the average for the period from 1961 to 1990, in mm.
Source: Intergovernmental Panel on Climate Change, 4th Assessment Report, 2007; http://www.ipcc.ch/publications_and_data/ar4/syr/en/figure-spm-1.html.
 

It is seen that over this interval the global average sea level has increased by about 190 mm (7.5 in.).  Furthermore, a report published on Nov. 28, 2012 finds that sea levels have been increasing in recent decades even faster than predicted earlier by the Intergovernmental Panel on Climate Change. 

Third, the path followed by Hurricane Sandy was not typical for Atlantic hurricanes.  They usually track northeastward following the coast of the eastern U. S.  Sandy took an abrupt shift westward after following a northeastward path, due to the presence of a blocking high pressure air mass over eastern Canada and Greenland.  It is possible that the this blocking high was present as a result of an Arctic summer in which more sea ice melted this summer than ever recorded previously.  Loss of ice results in absorbing more heat from sunlight during the Arctic summer than when more ice is present.  It is possible that this altered weather over the Arctic placed the blocking high in Sandy’s path, a pattern that would not have been present without the exceptional extent of melting of Arctic sea ice.

These and other factors contributed to an unprecedented extent of damage from the storm surge accompanying Hurricane Sandy; there was also damage and economic loss inland including massive losses of electric power.  Coincidentally, a report by Grinsted and coworkers (submitted for publication some months earlier) appeared in the Proceedings of the (U. S.) National Academy of Sciences (commentary here) .  They surveyed records of storm surges from previous hurricanes and found, using a storm surge index, that hurricane-associated storm surges have increased recently in correlation with the increase in the global temperature.  They found that the highest values of the index occurred with the most extreme storm events.  More generally, climate scientists foresee that the intensity, and possibly the number, of severe tropical storms will increase as global warming proceeds.

The economic costs of Hurricane Sandy are hard to estimate, but are extremely high.  The New York Times reports that New York’s Governor Andrew Cuomo and New Jersey’s Governor Chris Christie together have assembled the aggregate damage assessment of US$71 billion.  They intend to petition the U. S. federal government for assistance in meeting these emergency expenses.  This sum includes US$9 billion estimated by Gov. Cuomo to construct new facilities and devices intended to mitigate any new threat of more intense, more damaging storms in the future.  Gov. Cuomo broke down his damage estimates in some detail , itemizing the categories of government response, individual assistance, housing, business impact, health, schools, transit, roads and bridges, parks and the environment, water, waste and sewer, utilities, and government operation revenue.  He estimated that the storm destroyed or damaged 305,000 housing units, caused 2,190,000 customers to lose power, and impacted   265,300 businesses.  Overall, in 16 states 8,510,000 million customers lost power. 

Gov. Christie issued a preliminary estimate of damage in New Jersey of US$29.4 billion.  His estimates included personal property, businesses, transportation, utilities infrastructure, and effects on the state’s tourism industry.  As is likely true for all areas impacted by the storm, more long-term effects include loss of economic activity, induced population shifts and impacts on the value of real estate.  [Addendum on Dec. 5, 2012:  ADP, the payroll processing firm, estimated that for the month of November, 86,000 jobs were lost because of the hurricane.  Losses were highest in manufacturing, retailing, leisure and hospitality, and temporary help industries.]

Insured losses from Sandy estimated by three firms fall in the range of US$16-25 billion, according to Zacks Equity Research.  In addition, one of the firms estimated that lost economic activity can be estimated at US$50 billion; these typically are uninsured and cannot be recovered.  Many large insurance companies that cover losses in the area hit by the storm have indicated that their ability to absorb the benefit payments due from their coverages exceed their capacity.  [Addendum on Dec. 5, 2012:  For instance, the insurance companies Travelers Corp. and Allstate report that losses they sustained due to Hurricdane Sandy are each over US$1 billion. ]


Analysis

Extreme weather events such as Hurricane Sandy appear to be increasing in number and severity in recent years, in conjunction with the increasing global average temperature.  This pattern is consistent with the expectations from climate modeling for a warming planet, which foresees, at various locations on the surface of the earth, more intense storms, increasing rainfall with flooding, and more extreme heat waves with drought.  Previous posts have surveyed the economic consequences of earlier extreme weather in the U. S.  and globally.

Global warming and its harmful consequences for humanity reflect not the annual rate of emission of greenhouse gases, but rather their total concentration accumulated in the atmosphere.  As long as even low annual rates of emission continue, the accumulated total continues to grow.  Accumulated atmospheric greenhouse gases determine the extent of global warming.  Carbon dioxide, the principal greenhouse gas, remains in the atmosphere for decades or centuries.  Therefore the greenhouse gas level cannot retreat to values we experienced in earlier decades.  We are stuck with the greenhouse gases currently present, and the extent of global warming they confer, indefinitely.  If the world wishes to stabilize the global average temperature, necessarily at a new, higher value, we must work toward developing a zero-carbon energy economy. 

Each extreme weather event is a natural disaster inflicting enormous damage, both physical and economic, on its victims.  Societal harms also arise as social and local economic structures are disrupted.  Each event brings with it the need for compensation at a large scale to help victims recover and restore their lives and livelihoods.  Eventually all citizens pay for this, because relief comes from governments, insurance benefits, and private charities.  Costs attributed to governments potentially lead to higher taxes that we all bear, and insurance benefit payments lead to higher premiums that many of us will pay.

The alternative to unscheduled needs for emergency response to extreme weather events is to invest in creating a carbon-free energy economy. All nations of the world should be striving to achieve a zero emissions energy economy as soon as possible.  This means that instead of creating the need for even more emergency relief by continuing “business-as-usual”, we invest early in zero carbon energy.  These investments will help stabilize the atmospheric level of greenhouse gases at lower levels, so that warming of the planet is attenuated.

© 2012 Henry Auer

Wednesday, October 19, 2011

Americans Are Losing Sight of Global Warming as an Important Issue


Summary.   Elisabeth Rosenthal in the New York Times on Oct. 15, 2011 has documented the decreased attention that the issue of global warming is receiving in the U. S., in contrast to the rest of the world.  The portion of Americans who believe the earth is warming fell from 79% in 2006 to 59% in 2010.  This issue breaks out along lines that follow differences between the Democratic (liberal) and Republican (conservative) parties.  This reduction in importance is so even though the U. S. is a major world emitter of greenhouse gases.  According to the article, many aspects of individual and corporate attitudes reinforce America’s reluctance to embrace global warming as an important issue.  In contrast, nations of the remainder of the world, including Europe, China, and other developing countries, accept that global warming is an important issue facing the world, and are implementing policies to reduce emissions of greenhouse gases.

Climate scientists from all over the world have set a goal of limiting overall warming of the planet to 2ºC (3.6ºF) above the temperature prevailing in pre-industrial times.  This important objective requires limiting the accumulated amount of carbon dioxide in the atmosphere, not simply reducing the annual rate that greenhouse gases are emitted.  One motivation to stimulate the U. S. to implement suitable policies could be the recognition that economic and societal harms brought about by extreme weather events are balanced by the economic and societal benefits arising from new investments in mitigation projects.

Introduction.  Climate scientists the world over, as a result of efforts going back several decades, have concluded overwhelmingly that our planet is undergoing a warming trend  due to the greenhouse effect arising from man-made carbon dioxide (CO2) emitted into the atmosphere.  Our ever-increasing use of fossil fuels for mankind’s expanding needs for energy creates CO2 in large quantities as the direct product of burning the fuels.  Other gases added by man to the atmosphere also add to the greenhouse effect.  The warming of the planet has resulted in several effects, many of which are detrimental to life on earth, and in extreme weather events that inflict severe harms to humans in their paths.

In spite of this situation, the public in the U. S. has grown less concerned about the dangers posed by global warming, as described by Elisabeth Rosenthal in the New York Times on Oct. 15, 2011.  This post addresses topics raised in Ms. Rosenthal’s article.

U. S. public support to address global warming is waning.  Ms. Rosenthal reports that the portion of Americans who believe the earth is warming has fallen from 79% in 2006 to 59% in 2010 (citing the Pew Research Group).

Political denial and backtracking on global warming.  Perhaps reflecting this changing attitude, at least one Republican presidential hopeful, Gov. Rick Perry of Texas has stated “the science is not settled” concerning man-made global warming.  On Aug. 17, 2011 (accessed Oct. 19, 2011) he stated "a substantial number of [climate] scientists … have manipulated data so that they will have dollars rolling in to their projects…..We're seeing weekly, or even daily, scientists who are coming forward and questioning the original idea that man-made global warming is what's causing the climate to change".

Further in seeming recognition of this changing sentiment among the public as well as in Congress, Ms. Rosenthal reports that President Obama is promoting the administration’s “green” energy project proposals in economic terms, omitting any mention of beneficial effect such projects would have in combating greenhouse emissions.  The administration appears to support final approval for construction of the TransCanada Keystone XL oil pipeline carrying oil from Alberta’s tar sands to the Gulf of Mexico (see the recent post on this subject).  It is also seeking an exception from Europe’s planned landing fee for air travel to the continent based on CO2 emissions.

Nevertheless, the U. S. emits about 18% of the world’s greenhouse gases as of 2009, even though it has only 4.6% of the world’s population.  Until recently the U. S. was the nation with the highest annual emissions rate of all.  It was overtaken by the emissions originating from China.  Ms. Rosenthal identifies aspects of American culture, such as its preference for larger cars and homes, and the skepticism among many of its people toward the role of science and government policies in their daily lives, as factors that contribute to skepticism toward or rejection of global warming.

In addition, the article states American industries such as coal mining and oil and gas production oppose constraints on fossil fuels, since their financial well-being depends on continued production, if not expanded production.  The current protracted recession also makes it more difficult to accept higher costs for fossil fuels, or energy in general, that could accompany policies supporting renewable energy.

The rest of the world is moving to constrain greenhouse gas emissions.  As noted in Ms. Rosenthal’s article, a report on global energy by the London bank HSBC finds that the U. S. is the sole nation not implementing a program to reduce greenhouse gas emissions.  Other important emitters are actively pursuing such efforts.

Europe. The nations of the European Union have the significant goal of reducing greenhouse gas emissions by at least 80% by 2050, including an interim objective of a 25% reduction by 2020 (see this post).  According to the New York Times article, Europe is currently on track to achieve this interim goal. John Ashton, Britain’s special representative for climate change, points out that even in the face of economic hardship brought on by the global financial crisis, European countries view moving toward a “green” economy favorably, as an economic opportunity, not negatively due to the imposition of greater costs. “In the E. U. … despite the economic and financial crisis, the momentum on climate change has … continued”, Mr. Ashton states.

Developing countries.  China’s current 12th Five Year Plan covering 2011-2015 projects continued major expansions of electric power generation based on coal (see this post).  Its energy consumption is scheduled to increase about 5% per year in this period.  Nevertheless, it is greatly expanding its small renewable energy sources.  China emphasizes energy intensity rather than overall emissions.  It plans to reduce its emissions intensity per unit of economic output by 17% by 2015, and by 40-45% with respect to the 2005 level by 2020.  India is also pursuing aggressive efforts to reduce greenhouse gas emissions, according to the Times article.

Extreme weather events.  As noted in the Times article, climate scientists predict that with increased levels of atmospheric greenhouse gases accumulating in the future, the resulting increased global temperatures will produce more, and more intense, episodes of extreme weather events.  These include, in different regions on the earth’s surface, excessive heat with drought, increased rainfall with severe flooding and intense storms, loss of ice cover and higher sea levels.  These occurrences inflict sudden and severe harms to populations and societies.  This blog has developed several posts dealing with this issue in recent months, summarized here.  Ms. Rosenthal points out that developing countries are less well equipped to deal with these events than are developed countries.  They therefore embrace worldwide efforts to implement mitigating strategies.  The article cites a 2010 Pew survey finding that 70% of people in China, India and South Korea were prepared to pay more for energy in order to mitigate the effects of global warming.

Discussion

The United States is alone among the major emitters of greenhouse gases not to have a national policy directed toward reducing the rate of emissions.  Without such a policy, annual emissions from the U. S. will increase at an accelerating pace, as economic development and its population continue to grow.  If anything, fiscal incentives from the federal government for promoting mitigation efforts in the private realm have been increased and reduced in fits and starts, hindering the ability of new enterprises to make long-term plans for development. 

In the absence of a single national policy, various state and regional greenhouse gas accords have been implemented (reported in this blog in the following posts: California’s Global Warming Solutions Act, The Western Climate Initiative, Midwestern Greenhouse Gas Reduction Accord, and The Regional Greenhouse Gas Initiative of the New England and Mid-Atlantic States).  These programs establish disparate emission reduction goals over the coming decades.  Most encourage or rely on a market driven cap-and-trade regime to bring about emissions reductions.

Changes in climate patterns, including increases in sea level and reduced glaciation that are predicted to worsen because of global warming, depend not on the annual rate of global greenhouse gas emissions, but rather on the absolute amount of greenhouse gases accumulated in the atmosphere.  Carbon dioxide, the major greenhouse gas, which originates from mankind’s burning of fossil fuels for energy, remains stable in the atmosphere for at least one century, once emitted into the air (remaining after absorption into the oceans and reincorporation into growing green plants).  Thus it is important to reduce emissions as drastically as possible as soon as possible, in order to keep the accumulated level of atmospheric carbon dioxide as low as possible.

The atmospheric CO2 concentration can be conceived of as an atmospheric bathtub of CO2.  Burning fossil fuels contributes more CO2 through the “faucet”, but there is minimal “draining” of CO2 from the bathtub because there are few natural mechanisms for removing CO2 from the atmosphere.  Worldwide, mankind has to reach agreement on ways to turn the CO2 faucet off as fast as possible.

Currently the global average CO2 concentration is 392 parts per million (ppm, volumes of CO2 per million volumes of the atmosphere).  It has been increasing, and increasing at an ever-accelerating pace, since the beginning of the industrial revolution, when the concentration was about 280 ppm.  The climate scientists of the world, at their meeting in Copenhagen in 2009, under the auspices of the United Nations Framework Convention on Climate Change, agreed to seek the objective of limiting the overall increase in the global average temperature above the temperature that prevailed prior to the industrial revolution to 2ºC (3.6ºF), estimated to require that the global average atmospheric CO2 concentration be constrained to about 450 ppm.

In a series of recent posts this blog has shown that, on the one hand, economic and societal harms brought about by extreme weather events are balanced, on the other hand, by the economic and societal benefits arising from new investments in mitigation projects such as renewable energy programs and energy efficiency projects (summarized here, which contains further links to the remaining posts giving details of the analysis).  To the extent that U. S. investment in mitigation measures reduces the damages inflicted by extreme weather events, those investment costs are returned because the need to remedy disasters is reduced.  We conclude that the U. S. should implement a long-term national policy of developing mitigation measures intended to reduce greenhouse gas emissions, ultimately to near zero.  In this way the U. S. will join much of the planet in a world-wide strategy to stabilize atmospheric CO2 at the lowest possible level.

© 2011 Henry Auer