See the Tabbed Pages for links to video tutorials, and a linked list of post titles grouped by topic.

This blog is expressly directed to readers who do not have strong training or backgrounds in science, with the intent of helping them grasp the underpinnings of this important issue. I'm going to present an ongoing series of posts that will develop various aspects of the science of global warming, its causes and possible methods for minimizing its advance and overcoming at least partially its detrimental effects.

Each post will begin with a capsule summary. It will then proceed with captioned sections to amplify and justify the statements and conclusions of the summary. I'll present images and tables where helpful to develop a point, since "a picture is worth a thousand words".

Friday, October 31, 2014

The European Union Continues on Its Course to Lower GHG Emissions

The European Union confirms the next milestone along its energy Roadmap. The nations of the world are working toward establishing a new climate treaty by late 2015 that would lower future greenhouse gas emissions (among other provisions). Independently, the European Union (EU) agreed to a significant goal in reducing emissions of greenhouse gases (GHGs) on October 23, 2014.  The EU is a supranational organization of 28 member nations.  As detailed below, it has had policies in place for almost a decade to reduce GHG emissions.  The new pronouncement extends its timelines and codifies goals it had already established earlier.  Specifically, the EU agreed to lower GHG emissions by 40% below the emission levels of 1990 by 2030.  The goals also include achieving a 27% share of energy from renewable sources, and increasing energy efficiency by 27%.

Emission Trading Scheme. The EU began implementing policies to reduce GHG emissions as the Kyoto Protocol (KP) became effective.  Even before KP entered into force the EU created its Emission Trading Scheme (ETS) in 2005 in preparation for entering under its emissions restrictions.  The ETS is a cap-and-trade regime covering over 11,000 major fixed sources of GHG emissions, both governmental and corporate.  Unfortunately, for much of the time since then the ETS has failed effectively to set a market price for GHG emissions that would succeed to lower emissions.  Initially, too many allowances for emission were issued, so that their price tumbled.  As this was corrected, the Great Recession reduced economic activity, lowering demand for energy, again pressuring the price for allowances to fall.  As recently as 2013 the European Parliament temporarily suspended marketing new allowances.

The deliberations leading to the new declaration also had contentious issues .  Reducing emissions of carbon dioxide (CO2), the most prevalent GHG, affects coal-burning generating plants most severely because use of coal emits almost twice as much CO2 as does burning a fuel such as natural gas.  Countries in the EU heavily reliant on coal for electricity, such as Poland and other eastern European countries, were concerned that the excessive burdens of complying with the new constraints would hinder their economic growth.  The United Kingdom objected to goals for installing renewable power because of its new-found energy wealth in natural gas.  Germany has shut down its nuclear power plants after the Fukushima disaster, placing a greater burden on its existing coal-fired plants.

The new declaration keeps the EU within its overall timeline for long-term, major reductions in GHG emissions according to its energy Roadmap (see below).  But several environmental scientists and commentators consider the plan to be inadequate to achieve the stringent Roadmap objective in 2050.  They are concerned that the plan would leave too much of the intended reduction in emissions to be achieved later, in the two decades between 2030 and 2050, an achievement that may challenge the best technologies and policies available.  For example, Richard Black, the director of the British Energy and Climate Intelligence Unit, a nonprofit organization, doubted that this plan would “allow the E.U. to meet its long-term target of virtually eliminating carbon emissions.”

Background

The countries of the world currently face highly disparate energy situations and climate environments.  Their different conditions color their outlook as the world faces the problem of global warming brought on by humanity’s use of fossil fuels for energy.  In developed nations, which have benefited from the industrial revolution since its early days, citizens are comfortable with the lifestyle that abundant energy affords them.  Many are reluctant to change their ways to reduce emissions.  

Developing nations, on the other hand, have been applying energy-intensive technologies to expand their economies only in recent decades, desiring to catch up to the developed countries in relatively unconstrained fashion.  Their people too are reluctant to move away from fossil fuels to fulfill their growing energy needs. 

Impoverished countries and island nations experience the harms brought on by global warming for which they have not been responsible.  Their citizens hunger for the benefits that wider energy use could provide; those in island nations face encroaching seas as land-based ice sheets continue melting.

The United Nations Framework Convention on Climate Change (UNFCCC) has scheduled periodic global climate reports by the Intergovernmental Panel on Climate Change since 1990.  The UNFCCC led to negotiation of the Kyoto Protocol (KP) in 1997.  KP required developed countries to reduce greenhouse gas emissions, but excluded developing and impoverished countries from coverage.  KP entered into force in 2005 after the requisite number of countries ratified it (the U. S. never did, so it was not governed by its restrictions).  Most nations acceding to KP agreed to reduce emissions by varying amounts, generally less than 10%, below emission levels of 1990 by 2012. 
 
The  European Union issued a Roadmap for greenhouse gas emission reductions in 2011, intending to reduce annual emission rates by 80-95% below the level of 1990 by 2050 (see the following graphic). 

Source: “A Roadmap for moving to a competitive low carbon economy in 2050”,  broken down by economic sector. European Commission, March 8, 2011;
  
 
Interim milestones were established for reductions in emission rates of 7% by 2005, 20% by 2020, and 40-44% by 2030.  The European Environment Agency determined in 2013 that the EU is on track to achieve the 2020 milestone.  Renewable fuel use had climbed to 14% of total energy consumption.  About two-thirds of this originates from burning biomass and waste; in Sweden and Austria hydropower is also an important renewable source of electricity.  Wind and solar power contribute relatively small amounts to generation except for Denmark and Portugal (wind) and Cyprus and Spain (solar).
 
The EU is the most proactive region among developed countries in establishing policies to lower emission rates of GHGs.  The U. S., in contrast, has no legislated national energy policy directed toward mitigating GHG emissions.  In light of this failing executive actions of the Obama administration have imposed major limits on fossil fuel use in the transportation sector, have limited emissions from new electric power plants, and are proceeding similarly to lower emissions from power plants already in service.
 
Emissions from the developed countries of the world considered as a group have been relatively unchanged in recent years, and are projected to continue that trend (see the graphic below).


Annual rates of energy usage for China, the U. S. and India.  Actual use up to 2010; projected usage thereafter.  1 quadrillion = 1 million billion.  Btu, British thermal unit.
Source: U. S. Energy Information Administration; http://www.eia.gov/pressroom/presentations/sieminski_07252013.pdf (slide 5).

 
Energy use by developing countries will continue growing up to at least 2040, in contrast to the projected behavior of industrialized countries.  In the graphic above, expected energy use by China and India, which exemplify developing countries, expands dramatically in future years.  As noted earlier, energy use for the U. S., an example of a developed country, grows only very modestly to 2040.
 
Conclusion

The declared intention of the European Union to continue meeting its milestones under the energy Roadmap to 2050 is a major contribution to mitigating worldwide GHG emissions.  Similarly the executive actions taken by the U. S. have set it along a similar path, even if not enshrined in law.  These examples show “leadership by example” for the rest of the world as negotiations proceed toward a new worldwide climate treaty intended for completion at the end of 2015.  The continued expansion of fossil fuel use by major developing countries such as China and India, among others, stands in marked contrast to the examples of the EU and the U. S.  If left unaltered, policies of developing countries could potentially impede negotiation of a meaningful treaty.  Yet significant progress toward mitigation of GHG emissions must be made in order to keep the world’s long-term average temperature from increasing more than 2ºC (3.6ºF) higher than the prevailing temperature before industrialization.  This is the upper bound adopted at the Copenhagen (2009) and Cancun (2010) conferences of the UNFCCC.  The nations of the world must succeed in these negotiations.

© 2014 Henry Auer


Friday, October 17, 2014

Deniers Mistakenly Say that Global Warming Has Ended


Global Average Temperatures and CO2.  The global average temperature has increased by about 0.7-0.8ºC (1.3-1.4ºF) over pre-industrial values.  Humanity’s use of fossil fuels to power industrialization emits carbon dioxide (CO2), a greenhouse gas, leading to warmer average temperatures.  Analysis of the increased CO2 levels shows that they arise directly from burning fossil fuels, and not from natural causes (see also the U. S. National Climate Assessment).

Climate deniers do not accept that our planet is warming, and/or that human activity is its cause.  Climate skeptics may question that human actions are responsible for warming, or that warming is harmful to human populations and other life forms.  Here both groups will be called “deniers”.

Climate deniers claim that global warming has ended.  They selectively display global temperature data for, say, the period 1980 to the present, as shown in this graphic:
 
 
Yearly values of the global average temperature selected for the interval 1980-2013, shown as their difference from the average temperature for the entire 20th century.
Source: Data table from National Aeronautics and Space Administration;
 
 
Other more biased presenters don’t show any data before 1997.  These deniers point to the interval after 1997 as showing that the temperature has remained essentially unchanged (here called the “pause”), breaking with the upward trend from 1980 to 1997.  Since atmospheric CO2 concentrations continued to increase during the pause period (see below), deniers state that increasing atmospheric concentrations of CO2 cannot be the cause for global warming.

 
Deniers  cannot selectively choose the data they wish to use while rejecting the entire data set from consideration.  It is unacceptable to focus arbitrarily on only the period supporting their view while ignoring the extended global temperature record.  Data covering most of the industrial era, 1880-present, are shown below. 
 

Yearly values of the global average temperature for 1880-2013, shown as the differences from the average temperature for the entire 20th century.  Black points and line, annual average temperature differences; Red line, smoothing obtained as a 5-year running window centered at each data point; Green, error bars showing estimates of uncertainty in the measurements.
Source: National Aeronautics and Space Administration.  http://data.giss.nasa.gov/gistemp/graphs_v3/
 
 
The overall trend shows a clear, if uneven, rise in the global average temperature beginning at about 1910, coinciding with increasing atmospheric levels of CO2 (see below and this post).  Importantly, a seemingly long pause also occurred from about 1950-1975, followed by more than 20 years in which the temperature rose sharply.  It is noteworthy that deniers fail to mention this earlier pause as evidence that warming has ceased.
 
A Simple Inert Earth Model.  Deniers are incorrectly assuming that in the Earth system, the only factor affecting the air temperature around the globe is the amount of CO2 in the atmosphere.  Such a simple model, featuring an inert Earth, may be illustrated using the following graphic.  

Model for a simplified inert Earth system close to radiation balance.  It re-emits much of the sun’s energy back into space as heat (infrared) radiation.  In this model only the atmosphere retains excess heat.  © Henry Auer

 
In essence, deniers ignore any additional components in the Earth system that affect the energy balance.

A Complex Earth System Model.  Why is the Earth’s temperature record so erratic?  Why do these pauses occur?  The answer to these questions is that the Earth is not a simple object inert to the effects of the sun’s energy.  Rather, the Earth is a complex system that responds to inputs of excess energy from the sun in many ways.  This can be modeled by a complex Earth system in the image below.
Model of the Earth system, including CO2 in its atmosphere and potential reservoirs of heat in the land, the oceans and the polar ice caps.  This Earth is not in energy equilibrium; less energy is radiated back into space than the energy falling on it from sunlight.  The extra energy heats the entire earth system, with most of the heat being stored in the ocean rather than in the atmosphere. © Henry Auer

 
This more realistic model for Earth is not in energy balance.  Direct satellite measurements of radiation leaving Earth are compared with sunlight energy reaching the Earth.  Because of the greenhouse effect the Earth retains excess heat, rather than re-emitting it back into space.  

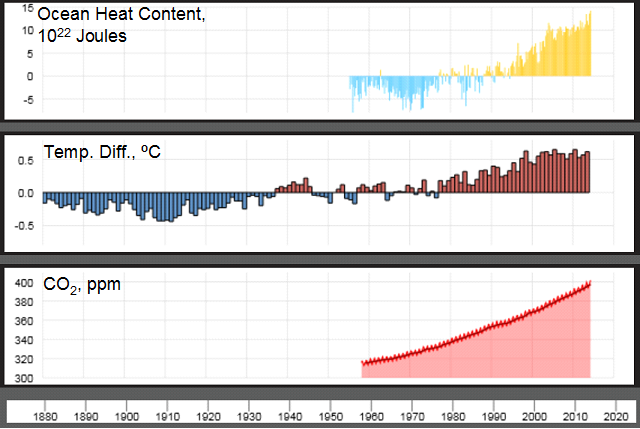
Most of the retained heat is stored in the oceans, and not in the atmosphere.  This is why deniers are mistaken by speaking in terms of an inert Earth model, i.e., in assuming that the temperature in the atmosphere is determined only by the atmospheric CO2 concentration.  This is shown in the following graphic.
 

Top panel: Total heat energy stored in the top half-mile of Earth’s oceans compared to the average from 1955-2006.  Middle panel: Yearly global average temperature compared to the average value for the full 20th century (repeating the pattern shown in the earlier graphic).  Bottom panel: Direct measurement of atmospheric CO2 from 1958 in parts per million (ppm).
Source: National Oceanic and Atmospheric Administration;
 
 
It is seen from the lower panel that the CO2 concentration has been rising steadily since 1958; indeed a smooth curve such as seen here extends back to pre-industrial times, when the concentration was 280 ppm.  The pronounced variability in the temperature data (middle panel) contrasts with the smooth, steady increasing trend seen  for CO2.  This suggests, as indicated above, that factors other than only the atmospheric CO2 concentration are at play. 
 
90% of the excess heat retained in the Earth system is stored in the oceans.  The data in the top panel show that heat energy absorbed by the oceans has been steadily increasing since at least about 1970, including the prior pause of global atmospheric temperature, and has continued to increase even during the current pause.  Instead of ending up warming the atmosphere, excess heat has been absorbed into the oceans, warming them (see the Details section at the end of this post).  Since oceans have decade-long cycles of vertical as well as lateral currents, this heat remains latent in the oceans, but will eventually be transferred back to the atmosphere, renewing the trend of increasing global atmospheric temperature.  
 
Conclusion
 
The long-term global average temperature has increased by about 0.7-0.8ºC over pre-industrial temperatures.  A current pause of annual global temperatures began after 1997 even though the atmospheric concentration of CO2 continued to increase during this period.  Global warming deniers have seized on this pause to say that warming of the Earth has ended, since the air temperature has not responded to the increased CO2 concentration on a year-by-year basis. 
 
In fact direct measurements of the Earth’s energy balance show that it does retain excess heat, but does not store it in the atmosphere.  Rather, the excess heat enters the oceans.  It is stored there as deep as 1,500 m (4,920 ft) in slow-moving ocean currents, both lateral and vertical.  As the warmer water is lifted to the surface again, it will exchange this stored heat with the atmosphere, resuming the warming of the air.  Similar processes happened in an earlier pause event.  Global (atmospheric) warming continues on the extended time scales dictated by Earth system processes.  Global warming deniers are mistaken in saying that global warming has ended.
 
Details
 
Guemas and coworkers (Nature Climate Change vol. 3, pp. 649–653 (2013); doi:10.1038/nclimate1863)  examined the current pause in global warming.  They used earlier data as a baseline to project sea surface temperatures forward up to 2010 using a coupled ocean-atmosphere climate model.  From their results they “attribute the onset of [the pause] to an increase in ocean heat uptake.”  They verify that no reduction in the sun’s radiation can explain the pause.
 
Loeb and coworkers (Nature Geoscience, vol. 5, pp. 110–113 (2012); doi:10.1038/ngeo1375) compared the energy imbalance of the Earth system with ocean heat content.  They measured radiated heat energy and sea temperatures.  They found that the energy imbalance of the Earth system and the increase in the upper-ocean heat content are similar in magnitude.  Combining satellite temperature measurements and ocean heat measurements to 1,800 m (5,900 ft) they found “between January 2001 and December 2010, Earth has been steadily accumulating energy at a [significant rate]. We conclude that energy storage is continuing to increase in the sub-surface ocean.”
 
Chen and Tung (Science Vol. 345, pp. 897-903 (2014)  DOI: 10.1126/science.1254937) analyzed earlier data as well as more extensive newer observations gathered by buoys disposed worldwide at various ocean depths.  They found that “the [pause] is mainly caused by heat transported to deeper layers in the Atlantic and the Southern oceans….Cooling periods associated with the latter deeper heat-sequestration mechanism historically lasted 20 to 35 years.”  They further conclude “because the planetary heat [reservoirs] in the Atlantic and the Southern Oceans remain intact, the [pause] should continue on a decadal time scale. When the internal variability that is responsible for the current [pause] switches sign, as it inevitably will, another episode of accelerated global warming should ensue.”
 
© 2014 Henry Auer


Thursday, October 2, 2014

U.N. Climate Summit Underscores Perennial Differences on Climate Change

The United Nations convened a Climate Summit on September 23, 2014 as a springboard for action on addressing global warming.  About 120 national leaders attended, as well as leaders in business, government and action groups.  Notable by their absence were the leaders from China and India, two of the nations among developing countries with the highest annual rates of emission of greenhouse gases (primarily carbon dioxide (CO2)) and/or the highest rates of growth in those emissions from year to year.

Negotiations toward a new international climate treaty to stabilize the world’s average temperature are about to begin under the U. N. Framework Convention on Climate Change (the Convention).  Work on the treaty will proceed for next 14 months, with the goal of reaching agreement by December 2015.  The new treaty is considered a follow-on compact to succeed the Kyoto Protocol (Kyoto), negotiated in 1997. 

Kyoto adopted the same wording as appears in the Convention, namely that nations of the world address climate change “on the basis of equity and in accordance with their common but differentiated responsibilities and respective capabilities”.   This phrasing reflects the concerns that “the developed countr[ies] should take the lead in combating climate change” and that the “specific needs and special circumstances of developing countr[ies]…should be given full consideration”.  

As a result, the final Kyoto treaty applied only to developed (i.e., already industrialized) countries such as the U. S., those of Western Europe, Japan and Australia.  Under Kyoto, each of these countries was to reduce its emissions of CO2 and other greenhouse gases (GHGs) by specified amounts (typically a few percent) by 2012 from the levels of 1990. It attracted enough signatories to become enforceable by 2005, and it expired in 2012.

Although President Clinton supported Kyoto, the U. S. rejected it so that it was not bound by its terms.  Arguments against approval included the distinction in the treaty between developed and developing countries mentioned above, which, it was argued, would put the U. S. at a disadvantage in international commerce.

Economic Growth, Energy and GHG Emissions

Economic growth depends critically on use of energy.  In 1997, the year that Kyoto was signed, energy use in China and India, while growing, were still very low, much lower than that of the U. S., as seen in the graphic below.
 
Annual rates of energy usage for China, the U. S. and India.  Actual use from 1990 to 2010; projected usage thereafter.  1 quadrillion = 1 million billion; Btu, British thermal units.
 
 
But use of energy by both these countries expanded rapidly, and China’s became higher than that of the U. S. by about 2009. 

As China has drastically expanded its energy consumption, its annual rate of CO2 emissions has similarly grown dramatically, as seen in the graphic below.

Annual rates of CO2 emission attributed to the burning of fossil fuels from 1980-2011, for China, India and the U. S.  The numbers on the left of each panel show the lowest and highest values on the vertical axis, enlarged for legibility.  Note that the vertical axes are not comparable across the panels.
 
 
Numerical data for these countries’ growth in energy use and CO2 emissions are given in the Details section at the end of this post.  As the graphics above show, China and India, which are good examples of many developing countries, have expanded economic activity and CO2 emissions many-fold over these decades, while the U. S., typical of most industrialized countries, has remained essentially constant, due at least in part to actions taken under Kyoto or aligned with it.  This shows how “differentiated responsibilities and respective capabilities” stated in the Convention have developed over this time: developing countries have been at liberty to undergo unbridled expansion, while developed countries have emphasized measures to limit emissions.

 
The speeches at the U. N. Climate Summit reflect the ambiguity of the Convention statement discussed above.  Examples drawn from the U.
S.
(a developed country), China (a developing country), Mali and the Maldive Islands (impoverished or less developed countries) are summarized here and expanded in the Details section.  They show the differing circumstances and needs among the groups.

 
The U.S. President urged all nations to work toward a meaningful climate treaty to preserve present conditions for our children and future generations.  He pointed to the major policies the U. S. is undertaking to achieve significant reductions in GHG emissions and promote adaptation.   China, on the other hand, emphasized its efforts to increase efficiency of energy production and use (while omitting mention of actual emission amounts), increasing renewable energy sources and setting a goal of capping emissions. 

 
Mali (speaking partly for others in Africa as well) and the Maldives identified themselves as suffering the consequences of global warming due to actions of others whom they cannot control.  They demanded early, meaningful measures for assistance in adaptation to the effects of global warming, and emphasized the importance of policies promoting mitigation of further warming.
 

Analysis

 
Equity, and Common but Differentiated Responsibilities and Capabilities
 
This post has emphasized the differences separating developing and developed countries concerning global warming.  Developing countries tend to stress equity in insisting that they be given the same opportunity to develop, using fossil fuels for energy, that industrialized countries have benefited from for more than a century.  At the same time they point to the responsibility of those developed countries now to limit their emissions because of their advanced economic status.  These attitudes stress hindsight or past history.

 
Developed countries, on the other hand, presumably consider equity as supporting a policy that, since developing countries are now the ones expanding the world’s burden of atmospheric GHGs, they should bear the “differentiated responsibility” of constraining their emissions.  This means not only slowing the growth in annual emission rates, but actually reducing annual emission amounts.  Developed countries are already doing this, as seen in the European Union and the U. S.  These policies reflect foresight with a vital concern for the future environment of our planet.  They accept the present status of emissions among the world’s nations, and strive to reduce them regardless of past history. 

 
Equity should also entail taking into consideration the plight of the world’s most disadvantaged countries by supporting their mitigation and adaptation efforts.

 
Glen Peters, one of the authors of this year’s Global Carbon Budget report, has stated  “Since China is responsible for almost 30 percent of current global emissions and emissions continue robust growth, to have any realistic chance of keeping below [a limit of] two degrees [C increase over pre-industrial levels] requires strong action by China.”

 
India rejects the notion of constraining its growth and reducing its emission rate, according to Prakash Javadekar, its environment minister.  India’s first responsibility, he stated, is to reduce poverty and expand the country’s economy, rather than reduce GHG emissions.  In his view, a principal culprit of emissions is the U. S.

 
In the opinion of many climate scientists, little time remains to embark on meaningful mitigation of GHG emissions.  Stocker has characterized the tradeoff of delaying mitigation vs. the intensity of mitigation policies required.  The FifthAssessment Report
of the Intergovernmental Panel on Climate Change forcefully favors substantive mitigation efforts.  Developing countries are projected to continue emitting GHGs at ever-increasing annual rates, as shown in the first graphic above.

 
Friedlingstein and coworkers (Nature Geoscience, vol. 7, October 2014, pp. 709-715; published online: 21 September 2014; DOI:10.1038/NGEO2248) find that the world has already exhausted 2/3 of its “carbon budget” that would keep it below the warming threshold of 2ºC (3.6ºF).  Given that the world’s annual emission rate is increasing year by year, they believe not more than 30 years remain before the full budget will be exhausted.  They conclude that “Breaking current emission trends in the short term is key to retaining credible climate targets within a rapidly diminishing emission quota.”

 
The world has no alternative but to negotiate a significant and effective new climate treaty.  Nations must bring themselves to abandon the hindsight view of the Convention’s principles.  They have to accept the present status and the dire projections of future environmental damage.  They must adopt the prospective view.  For example, investments in the energy economy should be directed toward renewable energy and energy efficiency, not toward new fossil fuel infrastructure.  Our future, and that of our children and further progeny, requires no less. 

 
Details

 
Economic Growth, Energy and GHG Emissions

China’s energy use from 1997 (i.e., more than half way across the horizontal axis in the first graphic above) to 2011 had an average growth rate of 8.2%/yr,  and its CO2 emissions  for the same period grew by an averaged rate of 7.6%/yr (but note the sharp change in rates starting about 2001; second graphic).  India’s energy use increased by about 4.9%/yr and its CO2 emissions grew by an averaged rate of 5.1%/yr.  In the same period the use of energy in the U. S. remained essentially unchanged, and its CO2 emission rate fell by an average 0.1%/yr.  The behavior of other industrialized countries is similar.

 
These data illustrate how the original ambiguity of “common but differentiated responsibilities and respective capabilities” stated in the Convention has played out in the intervening years.  Most developed countries have taken concrete steps to lower the actual rate of emission of GHGs after Kyoto.  On the other hand, a country such as China has increased efficiency of use of energy by a few percent per year.  Even so, China’s overall demand for energy has grown at much faster rates.  As a result its net emissions balance still leaves the country with increased rates of GHG emissions in absolute terms, i.e., in terms of actual amount of GHG released into the atmosphere.  The energy usage projected by EIA to 2040 (first graphic) reflects this, both for China and for India.

 
The speeches at the U. N. Climate Summit

U. S. President Barack Obama addressed the Summit , observing “no nation is immune” from impacts of climate change and citing America’s recent hot temperatures, ocean flooding, high incidence of forest wildfires, droughts and heavy rainfall.  He continued “the climate is changing faster than our efforts to address it….Our citizens keep marching….We have to work together as a global community to tackle this global threat before it is too late….We cannot condemn our children, and their children, to a future that is beyond their capacity to repair.”  The President referenced his Climate Action Plan that includes many initiatives to address global warming in the U. S. He also stated he met with the Chinese envoy to the Summit (see the following paragraph) restating his belief “that as the two largest economies and emitters in the world, we have a special responsibility to lead.  That’s what big nations have to do.”  Recognizing that the world’s nations approach climate negotiations from vastly differing vantage points, the President stated an agreement “must be ambitious –- because that’s what…this challenge demands.  It must be inclusive –- because every country must play its part.  And, yes, it must be flexible –- because different nations have different circumstances.”

 
The Special Envoy of China’s President Xi Jinping, Zhang Gaoli, summarized (in English translation) China’s efforts in improving its energy efficiency, including removing older, more inefficient facilities from use and expanding production of renewable energy.  China projects even greater improvements in efficiency and intends to cap total energy consumption and “vigorously develop non-fossil fuels”.  Tellingly, he referred to the importance of the principle in the Convention, “common but differentiated responsibilities, equity and respective capabilities”, in the proceedings leading to the 2015 climate treaty.  He emphasized the role of trust in going forward, saying “in particular, developed countries need to intensify emission reduction and fulfill commitment …of 100 billion US dollars and technology transfer to developing countries by 2020.”

 
Minister Abdoulaye Idrissa Maiga of Mali (in remarks translated from French) called attention to the drought that affects sub-Saharan Africa.  He cited this region as “the most vulnerable in the world” to  the effects of climate change, since by the end of this century Africa “could lose between 25 and 40% of its natural habitat and sea level rise could destroy close to 30% of its coastal infrastructure.”   Yet Africa, he noted, emits the least amount of GHGs.  Accordingly, Mali supports the Convention’s principle of “common but differentiated responsibilities” in the framework of a new climate agreement.  Mali needs to deploy more than US$1 billion between 2015 and 2019, in five initiatives: reforestation, climate-resilient agriculture, a national agricultural management effort, preservation of water resources, and development of renewable energy and energy efficiency.

 
Dunya Maumoon, the Minister of Foreign Affairs of the Maldives (a low-lying island nation south of India), made an impassioned plea for the upcoming climate treaty negotiations: “The effects of climate change have no boundaries.  It does not differentiate [among countries].  The assumption that some countries are safe from climate change…is a dangerous myth.”  The Maldives, she stated, has already undertaken measures to reduce its emissions and adapt to climate change.  But it emits “just 0.00003 percent” of global GHGs while facing an existential threat [from inundation] because of worsening global emissions.  She asks “Is it not ironic that…the Maldives…are made helpless bystanders, while others who ignore the threat…decide our fate?”  In response to the climate marchers in New York on September 21, 2014, asking for action on the climate, Ms. Maumoon stated “It is clearly time for action”.

© 2014 Henry Auer