A 1½ minute video from NASA gives more information on this finding. It includes a speedy review, year-by-year and
location-by-location across a map of the globe, of how annual average
temperatures, in ºC (multiply by 1.8 for ºF), have increased from 1957 to 2014. (They are shown as the differences from a
30-year reference period from about 1945 to about 1975).
The ten hottest
years on record occurred between 1998 and the present (see Details section at
the end of this post).
The “pause” in rising temperatures of recent years is misleading. The new warm record for 2014 is significant because those who doubt the reality of global warming have pointed to an apparent “pause” in warming from about 1998 through 2013 (i.e., up to the time of the new NOAA/NASA report). The apparent “pause” may be seen in the image below, compared to the clearly rising temperatures before 1998.
[Update added January
26, 2015 ]: The
United Kingdom Met (i.e., meteorological) Office jointly with the University of
East Anglia reported, using their own data set, that 2014 was
tied with 2010 as the being the warmest year on record, within the 95%
confidence limit of their data. This
occurred even though 2014 did not experience a Pacific Ocean warming event known as El Nino.
The “pause” in rising temperatures of recent years is misleading. The new warm record for 2014 is significant because those who doubt the reality of global warming have pointed to an apparent “pause” in warming from about 1998 through 2013 (i.e., up to the time of the new NOAA/NASA report). The apparent “pause” may be seen in the image below, compared to the clearly rising temperatures before 1998.

Source: Data table from National Aeronautics and Space Administration;
http://data.giss.nasa.gov/gistemp/graphs_v3/Fig.A2.txt
The new result for 2014 places its data point slightly higher than the two next-warmest years, 2005 and 2010. Although it is too early to tell, the new information suggests that the earth may be resuming its climb to higher global average atmospheric temperatures.
The “pause” is
understood to be temporary, in any case, in view of the image below.

Source:
Intergovernmental Panel on Climate Change, 5th Assessment Report,
Part 1; http://www.climatechange2013.org/images/uploads/WGIAR5-SPM_Approved27Sep2013.pdf
The graphic shows
that there was an even longer “pause” between the late 1940’s and the mid 1970’s;
nevertheless, that “pause” ended and the global average temperature rose dramatically
in the three following decades. Since
trends in global warming become apparent only on long time scales, a decade or
longer, the bottom panel in the graphic above, presenting atmospheric
temperatures as ten-year averages, suggests that the purported “pause” in the
first decade of the 21st century may not be a significant “pause” at
all.
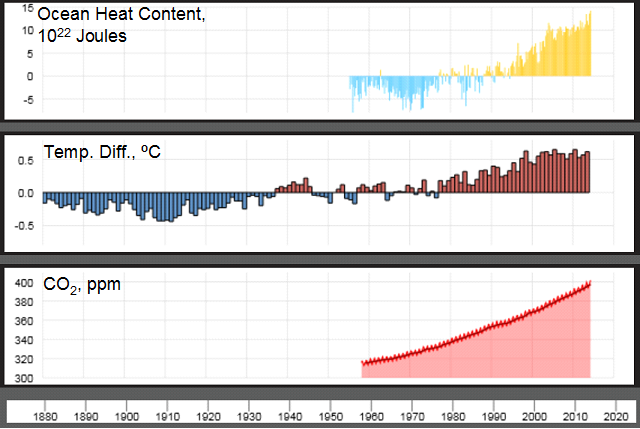
Ocean Heat
Content. The temperatures discussed above relate only
to surface air temperatures around the globe.
But 90% of the excess heat retained by the earth system is absorbed in
the oceans, measured in an upper zone down to a depth of 700 m (2,296 ft), as
well as in a deeper zone from the surface to 2,000 m (6,562 ft). A graph showing the time dependence of the
ocean heat content to both depths is seen in the image below.

Significantly, the image above shows
clearly that during the present “pause” in the global average air
temperature (1998-present) heat continued to accumulate in the waters of the
oceans down to 2,000 m without any “pause”. Thus, most of the excess heat absorbed by the
earth system due to global warming is stored in the oceans. Climate scientists have identified the role
of the oceans in storing excess heat in recent publications, and pointed out that
sooner or later that excess heat will be transferred back to the atmosphere
(see Details, below).
Conclusions
The year 2014 had the hottest annual
global average air temperature since record keeping began in 1880. This result, and related information
presented by NOAA and NASA, indicate that there may be no significant “pause” in
warming of the air temperature of the Earth, contrary to statements made by
global warming skeptics and deniers. The climate
scientist Michael E. Mann, at the Pennsylvania State University, wrote “It is exceptionally unlikely that we would
be witnessing a record year of warmth, during a record-warm decade, during a
several decades-long period of warmth that appears to be unrivaled for more
than a thousand years, were it not for the rising levels of planet-warming
gases produced by the burning of fossil fuels.” Stefan Rahmstorf, head of earth system
analysis at the Potsdam (Germany) Institute for Climate Impact Research stated “[T]he fact that the warmest years on record
are 2014, 2010 and 2005 clearly indicates that global warming has not ‘stopped
in 1998,’ as some like to falsely claim.”
Indeed, 90% of the excess heat
retained by the earth system is absorbed by the oceans, a process continuing
without a “pause” up to the present.
Long-lived ocean currents redistribute this heat around the earth and among
zones of varying depth. It takes many
years for heat to re-emerge to the surface and exchange back into the
atmosphere. Yet it is considered
essentially certain that this will indeed occur.
Global warming due to continued
emissions of greenhouse gases will continue indefinitely unless greenhouse gas
emissions are reduced. If the peoples of
the earth succeed in lowering annual emission rates to near zero, further
warming will come to an end, and the earth will experience a new, higher global
average temperature than we have now. We
must strive to reduce annual emission rates to (near) zero in order to minimize
the additional warming of the earth.
Details
The ten hottest
years on record occurred between 1998 and the present. The
second hottest years, only slightly less warm on average than 2014, were 2005
and 2010 (see the first graphic above).
The finding that 2014 exceeded all other records is even more
significant because it occurred in a year in which the El Nino Southern
Oscillation, a warming pattern in the Pacific Ocean ,
was absent.
NOAA presents the global map,
below, showing deviations in temperature
from the reference period 1981-2010 as color-coded shades grading the deviations
from the average.

Global grid showing color-coded deviations of the temperature in 2014 from the average temperature over the period 1981-2010. Red shades represent temperatures warmer than the average, and blue shades represent temperatures cooler than the average. (Grey regions had no data available.)
Source: NOAA; http://www.ncdc.noaa.gov/sotc/global/2014/13
The image above is
noteworthy, since it shows that there were many regions, both on land and
oceanic, recording record warmest average
temperatures whereas there was only one region, south of South America , having a record
coldest average temperature.
Indeed, most regions of the earth, both land and sea, had temperatures
in 2014 higher than the 1981-2010 average.
Climate scientists have pointed out in
recent publications that heat is accumulating in the oceans and that sooner or
later the excess heat will re-emerge, so that the
global average air temperature will resume climbing.
Loeb and coworkers (Nature
Geoscience, vol. 5, pp. 110–113 (2012) doi:10.1038/ngeo1375)
compared the energy imbalance of the Earth system with ocean heat content. Combining satellite temperature measurements
and ocean heat measurements to 1,800 m (5,900 ft) they found “between January
2001 and December 2010, Earth has been steadily accumulating energy at a
[significant rate]. We conclude that energy storage is continuing to increase
in the sub-surface ocean.”
Guemas and coworkers (Nature Climate
Change vol. 3, pp. 649–653 (2013) doi:10.1038/nclimate1863) examined the current “pause” in global
warming. Using historical ocean
temperature data and a coupled ocean-atmosphere climate model, they “attribute
the onset of [the “pause”] to an increase in ocean heat uptake.” They verify that no reduction in the sun’s
radiation was found which could explain the “pause”.
Chen and Tung (Science Vol. 345, pp. 897-903 (2014) DOI: 10.1126/science.1254937) analyzed earlier data as well as more extensive newer observations gathered by buoys disposed worldwide at various ocean depths. They found that “the [“pause”] is mainly caused by heat transported to deeper layers in the
© 2015 Henry Auer