See the Tabbed Pages for links to video tutorials, and a linked list of post titles grouped by topic.

This blog is expressly directed to readers who do not have strong training or backgrounds in science, with the intent of helping them grasp the underpinnings of this important issue. I'm going to present an ongoing series of posts that will develop various aspects of the science of global warming, its causes and possible methods for minimizing its advance and overcoming at least partially its detrimental effects.

Each post will begin with a capsule summary. It will then proceed with captioned sections to amplify and justify the statements and conclusions of the summary. I'll present images and tables where helpful to develop a point, since "a picture is worth a thousand words".

Showing posts with label skeptics. Show all posts

Friday, October 17, 2014

Deniers Mistakenly Say that Global Warming Has Ended


Global Average Temperatures and CO2.  The global average temperature has increased by about 0.7-0.8ºC (1.3-1.4ºF) over pre-industrial values.  Humanity’s use of fossil fuels to power industrialization emits carbon dioxide (CO2), a greenhouse gas, leading to warmer average temperatures.  Analysis of the increased CO2 levels shows that they arise directly from burning fossil fuels, and not from natural causes (see also the U. S. National Climate Assessment).

Climate deniers do not accept that our planet is warming, and/or that human activity is its cause.  Climate skeptics may question that human actions are responsible for warming, or that warming is harmful to human populations and other life forms.  Here both groups will be called “deniers”.

Climate deniers claim that global warming has ended.  They selectively display global temperature data for, say, the period 1980 to the present, as shown in this graphic:
 
 
Yearly values of the global average temperature selected for the interval 1980-2013, shown as their difference from the average temperature for the entire 20th century.
Source: Data table from National Aeronautics and Space Administration;
 
 
Other more biased presenters don’t show any data before 1997.  These deniers point to the interval after 1997 as showing that the temperature has remained essentially unchanged (here called the “pause”), breaking with the upward trend from 1980 to 1997.  Since atmospheric CO2 concentrations continued to increase during the pause period (see below), deniers state that increasing atmospheric concentrations of CO2 cannot be the cause for global warming.

 
Deniers  cannot selectively choose the data they wish to use while rejecting the entire data set from consideration.  It is unacceptable to focus arbitrarily on only the period supporting their view while ignoring the extended global temperature record.  Data covering most of the industrial era, 1880-present, are shown below. 
 

Yearly values of the global average temperature for 1880-2013, shown as the differences from the average temperature for the entire 20th century.  Black points and line, annual average temperature differences; Red line, smoothing obtained as a 5-year running window centered at each data point; Green, error bars showing estimates of uncertainty in the measurements.
Source: National Aeronautics and Space Administration.  http://data.giss.nasa.gov/gistemp/graphs_v3/
 
 
The overall trend shows a clear, if uneven, rise in the global average temperature beginning at about 1910, coinciding with increasing atmospheric levels of CO2 (see below and this post).  Importantly, a seemingly long pause also occurred from about 1950-1975, followed by more than 20 years in which the temperature rose sharply.  It is noteworthy that deniers fail to mention this earlier pause as evidence that warming has ceased.
 
A Simple Inert Earth Model.  Deniers are incorrectly assuming that in the Earth system, the only factor affecting the air temperature around the globe is the amount of CO2 in the atmosphere.  Such a simple model, featuring an inert Earth, may be illustrated using the following graphic.  

Model for a simplified inert Earth system close to radiation balance.  It re-emits much of the sun’s energy back into space as heat (infrared) radiation.  In this model only the atmosphere retains excess heat.  © Henry Auer

 
In essence, deniers ignore any additional components in the Earth system that affect the energy balance.

A Complex Earth System Model.  Why is the Earth’s temperature record so erratic?  Why do these pauses occur?  The answer to these questions is that the Earth is not a simple object inert to the effects of the sun’s energy.  Rather, the Earth is a complex system that responds to inputs of excess energy from the sun in many ways.  This can be modeled by a complex Earth system in the image below.
Model of the Earth system, including CO2 in its atmosphere and potential reservoirs of heat in the land, the oceans and the polar ice caps.  This Earth is not in energy equilibrium; less energy is radiated back into space than the energy falling on it from sunlight.  The extra energy heats the entire earth system, with most of the heat being stored in the ocean rather than in the atmosphere. © Henry Auer

 
This more realistic model for Earth is not in energy balance.  Direct satellite measurements of radiation leaving Earth are compared with sunlight energy reaching the Earth.  Because of the greenhouse effect the Earth retains excess heat, rather than re-emitting it back into space.  

Most of the retained heat is stored in the oceans, and not in the atmosphere.  This is why deniers are mistaken by speaking in terms of an inert Earth model, i.e., in assuming that the temperature in the atmosphere is determined only by the atmospheric CO2 concentration.  This is shown in the following graphic.
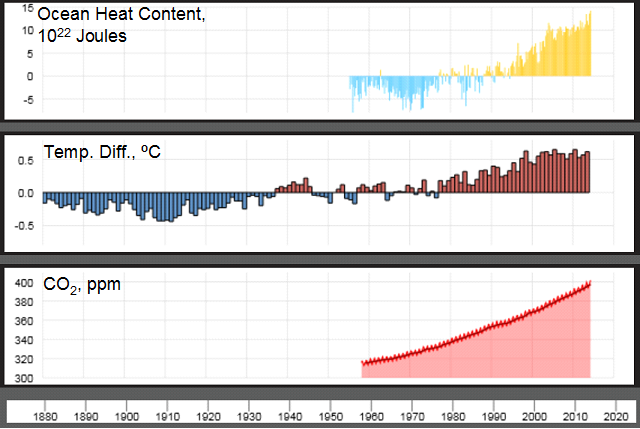
 

Top panel: Total heat energy stored in the top half-mile of Earth’s oceans compared to the average from 1955-2006.  Middle panel: Yearly global average temperature compared to the average value for the full 20th century (repeating the pattern shown in the earlier graphic).  Bottom panel: Direct measurement of atmospheric CO2 from 1958 in parts per million (ppm).
Source: National Oceanic and Atmospheric Administration;
 
 
It is seen from the lower panel that the CO2 concentration has been rising steadily since 1958; indeed a smooth curve such as seen here extends back to pre-industrial times, when the concentration was 280 ppm.  The pronounced variability in the temperature data (middle panel) contrasts with the smooth, steady increasing trend seen  for CO2.  This suggests, as indicated above, that factors other than only the atmospheric CO2 concentration are at play. 
 
90% of the excess heat retained in the Earth system is stored in the oceans.  The data in the top panel show that heat energy absorbed by the oceans has been steadily increasing since at least about 1970, including the prior pause of global atmospheric temperature, and has continued to increase even during the current pause.  Instead of ending up warming the atmosphere, excess heat has been absorbed into the oceans, warming them (see the Details section at the end of this post).  Since oceans have decade-long cycles of vertical as well as lateral currents, this heat remains latent in the oceans, but will eventually be transferred back to the atmosphere, renewing the trend of increasing global atmospheric temperature.  
 
Conclusion
 
The long-term global average temperature has increased by about 0.7-0.8ºC over pre-industrial temperatures.  A current pause of annual global temperatures began after 1997 even though the atmospheric concentration of CO2 continued to increase during this period.  Global warming deniers have seized on this pause to say that warming of the Earth has ended, since the air temperature has not responded to the increased CO2 concentration on a year-by-year basis. 
 
In fact direct measurements of the Earth’s energy balance show that it does retain excess heat, but does not store it in the atmosphere.  Rather, the excess heat enters the oceans.  It is stored there as deep as 1,500 m (4,920 ft) in slow-moving ocean currents, both lateral and vertical.  As the warmer water is lifted to the surface again, it will exchange this stored heat with the atmosphere, resuming the warming of the air.  Similar processes happened in an earlier pause event.  Global (atmospheric) warming continues on the extended time scales dictated by Earth system processes.  Global warming deniers are mistaken in saying that global warming has ended.
 
Details
 
Guemas and coworkers (Nature Climate Change vol. 3, pp. 649–653 (2013); doi:10.1038/nclimate1863)  examined the current pause in global warming.  They used earlier data as a baseline to project sea surface temperatures forward up to 2010 using a coupled ocean-atmosphere climate model.  From their results they “attribute the onset of [the pause] to an increase in ocean heat uptake.”  They verify that no reduction in the sun’s radiation can explain the pause.
 
Loeb and coworkers (Nature Geoscience, vol. 5, pp. 110–113 (2012); doi:10.1038/ngeo1375) compared the energy imbalance of the Earth system with ocean heat content.  They measured radiated heat energy and sea temperatures.  They found that the energy imbalance of the Earth system and the increase in the upper-ocean heat content are similar in magnitude.  Combining satellite temperature measurements and ocean heat measurements to 1,800 m (5,900 ft) they found “between January 2001 and December 2010, Earth has been steadily accumulating energy at a [significant rate]. We conclude that energy storage is continuing to increase in the sub-surface ocean.”
 
Chen and Tung (Science Vol. 345, pp. 897-903 (2014)  DOI: 10.1126/science.1254937) analyzed earlier data as well as more extensive newer observations gathered by buoys disposed worldwide at various ocean depths.  They found that “the [pause] is mainly caused by heat transported to deeper layers in the Atlantic and the Southern oceans….Cooling periods associated with the latter deeper heat-sequestration mechanism historically lasted 20 to 35 years.”  They further conclude “because the planetary heat [reservoirs] in the Atlantic and the Southern Oceans remain intact, the [pause] should continue on a decadal time scale. When the internal variability that is responsible for the current [pause] switches sign, as it inevitably will, another episode of accelerated global warming should ensue.”
 
© 2014 Henry Auer


Wednesday, May 21, 2014

A Denier Clouds Reality by Misrepresentations and False Accusations

Summary.  This writer recently attended a presentation by a global warming denier.  The speaker accused the climate scientists of the world, asserting that they lie, have an agenda, and conspire together while preparing global warming reports.  He also misrepresented factual findings related to global warming in a way that would cast doubt on the reality of the phenomenon.

This post refutes the positions taken by the denier.  The harms caused by global warming require knowledgeable, reasoned assessment of scientific observations, not maligning of the scientists involved in studying this subject.  It is not appropriate to shoot the messenger if one doesn’t agree with the message.  Likewise, misrepresenting scientific findings in a way intended to generate doubts about global warming cannot be tolerated.

The processes used to generate major reports and communicate to policymakers are rigorous and free of prejudice.  The reality of global warming is supported with virtually complete certainty by the full panoply of data available.

Introduction.  The most recent post published by this writer, “Denying Global Warming Has No Scientific Basis”, was intended as a one-time response to an email from a meteorologist, a denier of global warming.  On May 15, 2014, however, this writer attended a gathering of the New Haven, Connecticut section of the American Chemical Society.  The featured speaker was Art Horn, also a meteorologist, widely known locally from his role as a TV weatherman, talking on “Understanding Climate Change”.  It became quite clear that Mr. Horn is also a denier of the global warming phenomenon, whose opinions require a forceful and immediate rebuttal.

A denier maligns climate researchers.  Mr. Horn presented a slide, which showed a short range global temperature trajectory, whose stated message is “Claims that ‘global warming is accelerating’ are clearly lies to push an agenda, not science” (see the Details section at the end of this post).  As shown in the Details below, this slide is inaccurate in many ways, serving psychologically to goad the viewer to reject conclusions that global warming is happening.  Use of the terms “claims”, “lies” and “agenda” are manipulative but do not contribute to a fact-based discussion of the issue.  Such tactics must not be allowed to stand uncontested.

Allegations that climate scientists utter “lies to push an agenda” must be supported by documented evidence a) that lies (i.e., deliberate untruths) were told, and b) that an agenda exists which the supposed “lies” were intended to support.  Mr. Horn provided no such evidence in the presentation.  Accordingly his allegations must be dismissed out of hand.

A denier accuses climate scientists of conspiring to promote global warming fears.  Mr. Horn further accused climate scientists around the world of colluding to produce reports warning of the dangers of worsening global warming (see Details).  He believes they do this in order to continue receiving funding for their research.

In fact, some leading climate scientists have been subjected to harassment and censorship as they go about their work (see Details).  Clearly, such behavior in the face of threats is not consistent with the alleged conspiracy, for their behavior only serves to make their employment and research funding more insecure, not more certain.

Any assertions that the thousand or more climate scientists around the world engage in self-promoting conspiracies are ludicrous on their face, and must be substantiated by objective evidence openly presented.  In fact the operating rules set up for the release of major global warming reports effectively minimizes the opportunity for collusion (see Details).

Misrepresenting sea level rise.  Mr. Horn also projected selected graphics showing decreasing sea level trends for Alaska, Helsinki and Oslo (see Details).  On their face these data would appear to contradict the widely accepted view that global average sea level is rising.  But in fact, the U. S. National Oceanic and Atmospheric Administration (NOAA) presents an interactive graphic showing data obtained at the large number of sea level recording stations around the globe (see Details).  The vast majority of these stations shows an increase in sea level over the past several decades.  The Fifth Assessment Report, Part 1, The Physical Science Basis, of the United Nations Intergovernmental Panel on Climate Change (IPCC) clearly shows that the global average sea level has been rising continuously since 1900 (see Details). 

The outliers selected by Mr. Horn are explained by the phenomenon of post-glacial rebound, widely known among geologists (see Details).  Thus the exceptions chosen by Mr. Horn inappropriately seek to convey the impression that they are typical in showing that the sea level is decreasing.  In fact just the opposite is true; they are exceptions, since the sea level is rising for the planet considered as a whole.

Conclusion.  A denier resorted to unacceptable tactics during a presentation to a public audience.  His accusations and misrepresentations cannot stand, and must be opposed.  This post refutes the positions taken by the denier.  It insists that attacks on the motives of the messengers, the world’s climate scientists, accusing them of lying to support their agenda, be substantiated by objective evidence, but none has been advanced.  Accusations that scientists are conspiring internationally to gain and maintain funding must be accompanied by clear evidence supporting such allegations.  None was offered. 

A denier’s misrepresentation of worldwide sea level rise has been exposed in this post.  It is incontrovertible that worldwide average sea level has been rising for more than a century.

Deniers may be entitled to their opinions, but they are not entitled to misrepresent objective scientific findings, or to slur the people carrying out such studies.  Global warming is a reality and becoming more pronounced.  The correct response to that conclusion is to reach worldwide agreement on how to minimize its effects and how to protect against damaging processes already under way.

 
Details
 
A denier maligns climate researchers.  Among the misrepresentations in the presentation by Mr. Horn that this writer attended, two stand out for their descent into personal attacks on scientists.  One of the slides he showed, reproduced below, was found on his web site, where one can play numerous videos of his PowerPoint presentations.  Specifically, the following still image from the video “Global Warming Exposed by Art Horn Part 6” was included in his May 15 presentation:
 
Screen shot of a slide from a video by Art Horn.
 
There are several problems with the illustrated statement.  First, if the words in quotations represent a statement by an individual or group, the author of the statement must be identified.  A vague assertion of a “claim” leaves open whether anyone actually stated it.  Second, accusing anyone of lying is very serious, because it carries with it the notion of intent to deceive.  If the denier feels so strongly, it is his responsibility to provide evidence for such intent and for the nature of the deception.  Lastly, if the denier believes there is an “agenda”, he must identify its goals and provide evidence that climate scientists are promoting it.
No such corroborations were offered. 
 
A denier accuses climate scientists of conspiring to promote global warming fears.  During the presentation Mr. Horn also explained another slide to the effect that climate scientists around the world are colluding to produce reports warning of the harms anticipated from global warming.  According to Mr. Horn, they do this in order to continue receiving finances for their research from their funding agencies.  (This writer was unable to find a slide image in Mr. Horn’s videos displaying this message; such a slide was shown to an audience of at least 50 during the May 15 presentation.)  In other words, the speaker is accusing the vast majority of the world’s climate scientists of engaging in a vast conspiracy for their own venal purposes.
Statements of this nature are highly reprehensible, since they are directed at the individuals and not at the science underlying the debate.  In other words, if deniers don’t like the message, they presume to be free to attack the messengers instead. This cannot be tolerated.
 
Rather than promoting a worldwide conspiracy, prominent scientists are being harassed and censored.
James E. Hansen is a renowned veteran climate researcher who has been forthright in his warnings about global warming for decades.  During this time he was employed by the U. S. National Aeronautics and Space Administration’s Goddard Institute for Space Studies, a federal agency.  Had his superiors found fault with his scientific capabilities or his professional behavior, they could have relieved him from government employment.  This never happened.  What did happen, however, is utterly inconsistent with the conspiracy theory that Mr. Horn is promoting.  For during the years that President George W. Bush was Dr. Hansen’s boss, the scientist’s publications and public appearances warning of worsening global warming were constrained and/or subjected to prior review by his supervisors for political objectives, not scientific reasons.  In other words, by insisting on speaking the truth about global warming, Dr. Hansen ignored the censorship imposed by his superiors, and acted contrary to any notions of self-promotion and contrary to behavior that would help assure that his research support, indeed his employment, be continued.
 
In a second instance, the University of Virginia was subpoenaed by the State of Virginia to produce internal research documents of veteran climate scientist Michael Mann during his tenure there.  This action, conducted by the Attorney General (the chief prosecutor) of the State of Virginia, could have had the effect of intimidating Dr. Mann from spreading truthful information about global warming.  Again, his resistance to intimidation is contrary to what we might expect if Dr. Mann’s primary objective was to promote his professional standing among his supervisors and employer.
 
These examples of prominent scientists in conflict with their employers and funders are inconsistent with any notion of self-aggrandizing behavior that might be part of a conspiracy, whether national or worldwide.
 
Reports on global warming are prepared with stringent peer review and responsiveness to external oversight.  The extended, rigorous processes used to prepare national and international reports dealing with global warming convincingly eliminate opportunities for alleged conspiracies to be operating.
 
a) The Intergovernmental Panel on Climate Change used the following process to produce its Fifth Assessment Report (AR), including the following details for preparing Part 3:
  1. Governments and organizations nominate authors, who are then selected by the organizers of the Working Group (here called a “Part”)
  2. 449 coordinating lead authors, lead authors, contributing authors and review editors from over 58 countries were selected to prepare a first draft of Part 3, considering over 10,000 references to the scientific literature;
  3. The first draft was reviewed by 1,530 other experts who considered 16,188 comments provided by 602 expert reviewers from 58 countries;
  4. 939 individuals prepared a second draft;
  5. The second draft was reviewed by 469 expert reviewers from 53 countries, and by 24 governments, who provided 19,554 comments;
  6. The final draft of the Summary for Policymakers was prepared by representatives of 37 governments, considering 2,573 comments; and
  7. The final draft was approved and accepted by all 195 member nations of the IPCC, and released.
As a result of this thorough drafting and review process, the ARs are rigorously objective.  The reader cannot seriously believe that the ARs offer prejudiced or directed findings or opinions. Indeed, the approval and acceptance process likely leads to consensus positions on unresolved or contentious issues while minimizing the importance granted outlying results or evaluations.
 
b) The United States National Climate Assessment (NCA) used the following process to produce its report.
The NCA was prepared under the supervision of a federal advisory committee whose members were drawn from every department and agency, thirteen in all, substantively involved in an aspect of global change science or policy.  The Assessment itself was assembled by over 300 scientists and experts drawn from academic research settings, federal agencies and research facilities, state agencies, nongovernmental organizations, private consulting organizations, corporations and foreign research organizations.  The Assessment is based on citations to a large number of original research articles published in peer-reviewed journals, and other reports of comparable scientific validity.  A draft version was reviewed by others in federal agencies, the academic community, the public, and the National Academy of Sciences.  The final Assessment took 4,000 comments submitted by such groups into consideration. 
The details of this process provide high assurance that the Assessment communicates the scientific basis of the various aspects of global change treated, without projecting particular points of view not supported by scientific findings.
 
Misrepresenting Sea Level Rise.  During his presentation Mr. Horn projected a slide purporting to cast doubt on the widely understood phenomenon that globally, the sea level has been rising steadily for a long time  (again, this writer could not find this material in Mr. Horn’s videos).  Specifically, he showed decreasing sea level trends for the cases of Alaska, Helsinki and Oslo.  Images likely to be the same ones he presented, shown below, were culled by this writer from the website of the U. S. National Oceanic and Atmospheric Administration (NOAA).
Images of tide gauge readings from 1924 to 2006 for, left to right, Sitka, Alaska; Helsinki, Finland; and Oslo, Norway; showing decreases in the range of 2 to 3 mm/yr.
Source: U. S. National Oceanographic and Atmospheric Administration; http://tidesandcurrents.noaa.gov/.
 
What Mr. Horn neglected to show, however, is a worldwide rendering of sea level changes, such as the following interactive web page from NOAA showing a display of the locations of most (if not all) tide gauge stations worldwide.
 
Locations of tide gauges worldwide with arrows showing sea level rise (upward arrows) and sea level lowering (downward arrows).  The arrows are color coded for the range of the changes in mm/yr or feet/century using the color key included above.  Readings at various locations incorporate data from at least 30 years, and up to 150 years.
Source: U. S. National Oceanic and Atmospheric Administration; http://tidesandcurrents.noaa.gov/sltrends/sltrends.html.
 
(The reader is strongly encouraged to turn to the NOAA web page cited in the caption to the graphic.  Rolling a tracking device over each arrow gives its location and numerical value for sea level change.  One can expand the view to see various regions of the U. S., and can link to gauge locations around the world, including the images shown further above.)
 
It is quite clear from the display above that the vast majority of tide gauges worldwide shows rising, not decreasing, sea levels. 
 
Data such as these underlie the summary graphic for global average sea level shown in the IPCC Fifth Assessment Report, Part 1, The Physical Science Basis, shown below.

Global average sea level change from 1900 to the present.  Different colors represent different data sets.  Shaded bands show corresponding confidence limits.
Source: Intergovernmental Panel on Climate Change, Fifth Assessment Report, Working Group I, Summary for Policy Makers; http://www.climatechange2013.org/images/report/WG1AR5_SPM_FINAL.pdf
 
There can be no doubt from this image that the long-term trend of sea level for more than a century has been a continuous and unrelenting increase.
 
The isolated few examples of a decreasing sea level such as those “cherry-picked” by Mr. Horn are due to the phenomenon, widely recognized among geologists, of post-glacial rebound.  It is prevalent in sub-Arctic latitudes of the Northern Hemisphere (such as Alaska, Helsinki and Oslo), and similarly in Antarctica.  As glaciers melt the weight burden they impose on the underlying land masses is reduced.  As a result the land rises up, buoyed higher on the molten magma on which it floats.  As this process proceeds the apparent sea level is measured to be lower relative to the rising land mass.  Thus the melting of the glaciers and ice sheets producing post-glacial rebound is actually in agreement with the effects of global warming, not contrary to them.  Mr. Horn simply showed examples reflecting this geological phenomenon, perhaps selected to leave the impression that these exceptions are actually the norm, which they clearly are not.  It should be noted that Mr. Horn did not show any examples from the large number available that would actually have shown a rising sea level.
 
 
© 2014 Henry Auer

Thursday, May 15, 2014

Denying Global Warming Has No Scientific Basis


Summary.  A denier of global warming asserts that the recent U. S. National Climate Assessment includes statements “that are (at best) misleading”.  The denier inappropriately claims the Assessment’s use of a graphic image overlaying recent annual carbon dioxide emissions and annual values of global average temperature “shows correlation, and implies causation”.  The denier cites the Medieval Warming Period and the Little Ice Age, having occurred in the absence of significant change in carbon dioxide level, as showing that temperature variations need not even be correlated with carbon dioxide. 


This post shows this view to be overly simplistic.  Here the scientific findings presented in the previous post, “The U. S. National Climate Assessment: Warming Is Due to Human Actions” are summarized.  These demonstrate the scientific and logical rigor leading to the conclusion, based on all the relevant science (not merely a portion portrayed in a single graphic image), that manmade greenhouse gas emissions arising from burning fossil fuels are indeed responsible for global warming.  This post also uncovers inaccuracies and inconsistencies surrounding the denier’s citation of the Medieval Warming Period and the Little Ice Age in support of his assertion that temperature and carbon dioxide level are not connected. 

In fact it is shown here that observed global temperatures result from the combined effects of many climatic factors, of which the CO2 level is only one.  Carbon dioxide is, however, the principal driver of contemporary global warming.

 
Introduction.  Overwhelming evidence and the concurrence of the vast majority of climate scientists lead to the conclusion that manmade emissions of greenhouse gases are responsible for global warming and its harmful effects.  Even so, there are still those who are skeptical of or deny outright the causative relationship between greenhouse gases and global warming.

One such person is Thomas Wysmuller, a former meteorologist.  He responded to the post “The U. S. National Climate Assessment: Warming Is Due to Human Actions  (Human Actions) in an email to this writer seeking to discredit the U. S. National Climate Assessment (NCA).

The denier accuses the NCA of “misleading” information concerning the correlation of global average temperature and atmospheric carbon dioxide (CO2) concentration (see the first graphic in the Human Actions post).  First, the denier’s email incorrectly states that superimposed data for temperature and CO2 from 1880 to the present “shows correlation and implies causation” (emphasis in original).  Human Actions and the NCA provide a comprehensive set of stringent scientific evidence, of which  the temperature-CO2 correlation is but a part, that substantiates the causative relationship between emissions of CO2 from burning fossil fuels, and other sources, and the increase in the long-term global average temperature that is most apparent in the second half of the 20th century (see Details at the end of this post for full summaries of the data from Human Actions and the NCA).

Second, the denier’s email presented an alternative graphic from the work of Loehle and McCulloch (see Details) depicting positive temperature deviations during about 500-1150 CE (i.e., AD), a period called the Medieval Warm Period (MWP) and negative temperature deviations during about 1400-1900 CE, called the Little Ice Age (LIA); during both of these periods the atmospheric concentration of CO2, the principal greenhouse gas before the industrial revolution, remained relatively unchanged at about 280 parts per million (ppm; volumes  CO2 per million volumes of air).  The denier asserts “CO2 and atmospheric temperature are almost entirely in disconnect”.  There are several problems with these data (see Details). 

The Loehle-McCulloch graphic (see Details) leaves the impression that both the MWP and the LIA are well-defined worldwide phenomena that occur despite no significant change in atmospheric CO2 levels.  This denier would have us believe that the absence of a relationship between temperature and CO2 during these intervals shows these properties can never be dependent on each other.

This is a simplistic and improper assumption.  As shown in the Details, numerous scientific publications make clear that there are many factors affecting observed atmospheric temperature of which CO2 level is only one.  The denier also infers that the MWP and the LIA are worldwide phenomena.  Articles summarized below in Details show that these effects were only regional, not global.

What is significant for contemporary warming is that the increased temperature can be accounted for, after including the effects of all the other drivers of temperature, only by including the excess CO2 introduced into the atmosphere because humanity is burning fossil fuels for energy.  This factor was absent during geological time periods before the industrial revolution. 

Conclusion
A denier has failed to disprove that contemporary global warming is due to excess emissions of greenhouse gases that arise from human activity, primarily the burning of fossil fuels.

This post summarizes recent scientific reports demonstrating that manmade greenhouse gas emissions are causing contemporary global warming.  It also presents selected scientific articles that consider contributions from many energetic sources that may contribute to global warming.  They correctly emphasize that atmospheric CO2 concentration is not the sole factor governing warming.  A denier must keep all these contributions in mind.

Finally, a denier must be able to explain the additional consequences of global warming on the complete earth system, not only on the temperature of the air close to the surface of the earth.  These include facts such as a) about 90% of the excess heat from global warming ends up in the ocean, b) the total heat content of the ocean continues to increase, and c) mountain glaciers and ice sheets are melting at more rapid rates than earlier, leading to inexorable sea level rise.
 
Details
 
The Human Actions post and the NCA set out scientifically objective and logically rigorous demonstrations that excess atmospheric CO2 originating from mankind’s burning of fossil fuels is directly responsible for the increased global average temperature in the last several decades.

First, HumanActions summarizes its conclusion as follows:

1.     Since 1880 the atmospheric concentration of CO2 and the long-term average global temperature are highly correlated;

2.     Over the same time period emission of carbon (dioxide) into the atmosphere from burning fossil fuels and producing cement follows a time course strongly similar to those for temperature and CO2, suggesting that burning fossil fuels is a major contributor to the excess accumulation of atmospheric CO2;

3.     Francey and coworkers (see Human Actions) analyze a particular physical property of atmospheric CO2, showing unambiguously that the excess CO2 appearing during the industrial revolution originates from fossil fuels; and

4.     Climate model “hindcasts” show that only by including contributions to atmospheric CO2 from human factors can the global average temperature record from 1970 to the present be satisfactorily reproduced.

Second, the NCA, in its NCA Highlights, concludes

“Multiple lines of independent evidence confirm that human activities [such as burning of coal, oil, and gas, and clearing of forests] are the primary cause of the global warming of the past 50 years. The[y] have increased the concentration of carbon dioxide in the atmosphere by more than 40% since the Industrial Revolution….Natural factors like the sun and volcanoes cannot have caused the warming observed over the past 50 years….If not for human activities, global climate would actually have cooled slightly over the past 50 years. The pattern of temperature change through the layers of the atmosphere, with warming near the surface and cooling higher up in the stratosphere, further confirms that it is the buildup of heat-trapping gases (also known as “greenhouse gases”) that has caused most of the Earth’s warming over the past half century.”

In conclusion, because of the objective veracity of the scientific underpinnings of global warming, no legitimate assertions questioning these conclusions can be credibly proposed.

Loehle and McCulloch improperly convey misleading information concerning the MWP and the LIA.  The graphic displaying temperature deviations during the MWP and LIA, adapted from the original and cited by a denier, is shown below:
 
The mean relative temperature history of the earth (blue, cool; red, warm) over the past two millennia adapted from Loehle and McCulloch (2008) – highlighting the Medieval Warm Period (MWP) and Little Ice Age (LIA), together with a concomitant history of the atmosphere’s CO2 concentration (green).
Source: email to this writer from T. Wysmuller, citing Loehle, C. and McCulloch, J. H. 2008. Correction to: A 2000-year global temperature reconstruction based on non-tree ring proxies. Energy & Environment 19: 23-100;
 
First, the adapted graphic incorrectly labels the left vertical axis as “Global Temperature Anomaly”.  The use of the word “Global” is misleading and incorrect.  In the original article the corresponding graphic does not include this word in the label for the vertical axis.  Only this adapted version includes the word “Global”.

Second, labeling the temperature anomaly as “Global” is wrong.  As shown below in the various sections describing the work of other researchers, it becomes clear that the MWP and the LIA are regional in scope, not “global”.

Third, Loehle and McCulloch inappropriately excluded from consideration all temperature data based on analysis of tree ring properties.  In fact, tree ring proxies for temperature continue to be used by other climate scientists up to the present (see descriptions for articles by Kaufman, Villalba, and Mann, below).  This omission potentially introduces an unexplained bias into the Loehle-McCulloch graphic. 

Fourth, it is highly misleading for a denier to imply that CO2 concentration is the only factor governing average temperature.  Climate scientists have long recognized many other potential energetic factors affecting temperature (see the research articles described below).  What is important is that since the industrial revolution the excess CO2 added to the atmosphere by burning fossil fuels is the dominant factor driving warming in the recent decades (see Human Actions).

Villalba (Climatic Change 1994, Vol. 26, pp 183-197)  used tree ring and radiocarbon data to characterize temperature and precipitation in southern South America.  At one location studied, a cold interval from 900 to 1070 CE was followed by warmer intervals from 1080 to 1250, and again a cold period from 1270-1660.  At another location glacial advances were observed for the periods 1270–1380 and 1520–1670 C.E.  In a third location glacial advances were found from the late 1600s to the early 1800s.  These are distinct patterns that fail to suggest single worldwide events.  Villalba states that strong El Niño-Southern Oscillation (ENSO) Pacific oceanic trends were likely responsible for these events.

Mann shows that the LIA is regional, not worldwide (Mann, M.E., 2002, “Little Ice Age”, in Vol. 1, The earth system: physical andVolume 1, The Earth system: physical and chemical dimensions of global environmental change, pp 504–509;  M. C. MacCracken and J. S. Perry (editors) John Wiley & Sons, Ltd., Chichester).  Using temperature proxies including tree ring data, Mann presented temperature curves over 1,000 years from several regions in the world, shown below:
 
Estimated relative temperature variations for various regions from 1000 to 2000 CE, smoothed over as much as 100 years to show long-term trends.  The vertical axis shows ºC for panels (a) and (e), and relative variations for panels (b), (c), (d), (f), (g) and (h).  The rectangular box from before 1400 to after 1900 is labeled LIA.  Panel (e) for Central England represents the European Little Ice Age well.  Fennoscandia (panel (f)), Scandinavia.  Panels (b) and (f) are based on tree ring data.
 
 
It is evident that the period called the LIA is not a single global event, but is manifested in distinct ways in different regions around the world.  In particular, according to Mann, the variability includes among its causes changes in atmospheric circulation patterns, especially the North Atlantic Oscillation.  This is “the dominant mode of atmospheric circulation variation in the North Atlantic and neighboring regions, [having] a particularly strong influence on winter temperatures in Europe”.  The North Atlantic Oscillation cooled eastern North America and Europe while the western U. S. and the Middle East were warmer than usual, confirming the regional nature of temperature trends.  Volcanic eruptions episodically led to cooling as well.
 
Kaufman et al. (Science 2009, Vol. 325,  pp. 1236-1239) studied proxy temperatures in the Arctic regions of the Western and Eastern Hemispheres over the last 2000 years.  A long-term cooling, more or less linear from 0 to 1900 CE is attributed to weakening solar irradiation from 0 to 2000 CE.  Kaufman et al. find no evidence in the Arctic for either a MWP or a LIA.  Arctic temperatures rise sharply after 1900 CE, deviating from the long preceding downward trend.  This indicates that another climatic factor not previously present causes the strong positive deviation after 1900.
 
Mann et al. (Science 2009, Vol. 326, p. 1256) conclude that the MWP (termed the Medieval Climate Anomaly in their article) is partly due to La Niña cooling in the tropical Pacific, and that the LIA, most evident from 1400 to 1700 CE, is partly due to El Niño conditions and to the North Atlantic-Arctic Oscillation.
 
Miller et al. show that intense volcanic activity led to the onset of the LIA (Miller, G. H., et al., Geophys. Res. Lett., 39, L02708 (2012)).  Based on geological findings based in Northern Canada and Iceland they find that four large, sulfate-laden explosive volcanic eruptions occurred between 1250 and 1300 CE, with a further eruption episode around 1450 CE.  The initial cooling from these events was probably extended for longer times by ice-temperature feedbacks.
 
Marcott et al. studied worldwide and regional trends in temperature over the past 11,000 years (Science 2013, Vol. 339, pp. 1198-1201).  They found that temperature trends differed widely among (a) the Arctic and northern temperate, (b) the tropical, and (c) the southern temperate and Antarctic regions.  This shows that single “events”, such as a worldwide warming period or a worldwide glacial period, did not prevail during this interval. 
 
Data for possible sources for temperature variation were gathered. Solar irradiance was warming for both polar regions but less so for the tropics, effects that weakened as time progressed toward the present.  Atmospheric sulfate aerosols from volcanic activity  (exerting a cooling effect) were strongest in the earliest years but continued throughout the full interval.  Greenhouse gases increased from about 7,000 to about 1,000 years ago; their warming effect opposes the observed cooling trend and so cannot explain it.  The Atlantic Ocean meridional overturning circulation, which carries heat from the tropics to the North Atlantic, contributed cooling to the Northern Atlantic while lessening cooling in the South Atlantic, in agreement with observed land temperatures.  This study clearly points out the many potential contributions to global cooling and heating prior to the industrial revolution, and shows that most effects, when significant, are regional rather than global.

 
© 2014 Henry Auer