See the Tabbed Pages for links to video tutorials, and a linked list of post titles grouped by topic.

This blog is expressly directed to readers who do not have strong training or backgrounds in science, with the intent of helping them grasp the underpinnings of this important issue. I'm going to present an ongoing series of posts that will develop various aspects of the science of global warming, its causes and possible methods for minimizing its advance and overcoming at least partially its detrimental effects.

Each post will begin with a capsule summary. It will then proceed with captioned sections to amplify and justify the statements and conclusions of the summary. I'll present images and tables where helpful to develop a point, since "a picture is worth a thousand words".

Showing posts with label ocean heat content. Show all posts

Monday, January 19, 2015

2014 Was the Warmest Year Globally Ever Recorded

2014 had the highest global average temperature ever recorded.  The U. S. National Oceanic and Atmospheric Administration (NOAA)  and National Aeronautics and Space Administration (NASA ) jointly announced on Jan. 16, 2015 that the year 2014 was the hottest year since record keeping began in 1880.  This result represents the globally averaged temperature, for both land and ocean surfaces, over the entire year. 

A 1½ minute video from NASA gives more information on this finding.  It includes a speedy review, year-by-year and location-by-location across a map of the globe, of how annual average temperatures, in ºC (multiply by 1.8 for ºF), have increased from 1957 to 2014.  (They are shown as the differences from a 30-year reference period from about 1945 to about 1975).
The ten hottest years on record occurred between 1998 and the present (see Details section at the end of this post). 

[Update added January 26, 2015]: The United Kingdom Met (i.e., meteorological) Office jointly with the University of East Anglia reported, using their own data set, that 2014 was tied with 2010 as the being the warmest year on record, within the 95% confidence limit of their data.  This occurred even though 2014 did not experience a Pacific Ocean warming event known as El Nino.

The “pause” in rising temperatures of recent years is misleading. The new warm record for 2014 is significant because those who doubt the reality of global warming have pointed to an apparent “pause” in warming from about 1998 through 2013 (i.e., up to the time of the new NOAA/NASA report).  The apparent “pause” may be seen in the image below, compared to the clearly rising temperatures before 1998.

                 Global average temperature from 1980 to 2013.
                 Source: Data table from National Aeronautics and Space Administration;
                 http://data.giss.nasa.gov/gistemp/graphs_v3/Fig.A2.txt


The new result for 2014 places its data point slightly higher than the two next-warmest years, 2005 and 2010.  Although it is too early to tell, the new information suggests that the earth may be resuming its climb to higher global average atmospheric temperatures.

The “pause” is understood to be temporary, in any case, in view of the image below.

Global average temperatures from 1850 to 2012, presented as differences from the average temperature from 1961 to 1990.  The different colored lines represent different data records.  Top, annual data points; bottom, 10-year averages with the gray shading showing confidence estimates.
Source: Intergovernmental Panel on Climate Change, 5th Assessment Report, Part 1; http://www.climatechange2013.org/images/uploads/WGIAR5-SPM_Approved27Sep2013.pdf


The graphic shows that there was an even longer “pause” between the late 1940’s and the mid 1970’s; nevertheless, that “pause” ended and the global average temperature rose dramatically in the three following decades.  Since trends in global warming become apparent only on long time scales, a decade or longer, the bottom panel in the graphic above, presenting atmospheric temperatures as ten-year averages, suggests that the purported “pause” in the first decade of the 21st century may not be a significant “pause” at all.

Ocean Heat Content.  The temperatures discussed above relate only to surface air temperatures around the globe.  But 90% of the excess heat retained by the earth system is absorbed in the oceans, measured in an upper zone down to a depth of 700 m (2,296 ft), as well as in a deeper zone from the surface to 2,000 m (6,562 ft).  A graph showing the time dependence of the ocean heat content to both depths is seen in the image below.

Five-year averaged relative global ocean heat content through 2013 for the upper zone (0-700 m) and the full-depth zone (0-2000 m), evaluated as the difference from the average heat content between about 1975 and 1990. Source: NOAA; http://www.nodc.noaa.gov/OC5/3M_HEAT_CONTENT/ .


Significantly, the image above shows clearly that during the present “pause” in the global average air temperature (1998-present) heat continued to accumulate in the waters of the oceans down to 2,000 m without any “pause”.  Thus, most of the excess heat absorbed by the earth system due to global warming is stored in the oceans.  Climate scientists have identified the role of the oceans in storing excess heat in recent publications, and pointed out that sooner or later that excess heat will be transferred back to the atmosphere (see Details, below).

Conclusions

The year 2014 had the hottest annual global average air temperature since record keeping began in 1880.  This result, and related information presented by NOAA and NASA, indicate  that there may be no significant “pause” in warming of the air temperature of the Earth, contrary to statements made by global warming skeptics and deniers.  The climate scientist Michael E. Mann, at the Pennsylvania State University, wrote  “It is exceptionally unlikely that we would be witnessing a record year of warmth, during a record-warm decade, during a several decades-long period of warmth that appears to be unrivaled for more than a thousand years, were it not for the rising levels of planet-warming gases produced by the burning of fossil fuels.”  Stefan Rahmstorf, head of earth system analysis at the Potsdam (Germany) Institute for Climate Impact Research stated   “[T]he fact that the warmest years on record are 2014, 2010 and 2005 clearly indicates that global warming has not ‘stopped in 1998,’ as some like to falsely claim.”

Indeed, 90% of the excess heat retained by the earth system is absorbed by the oceans, a process continuing without a “pause” up to the present.  Long-lived ocean currents redistribute this heat around the earth and among zones of varying depth.  It takes many years for heat to re-emerge to the surface and exchange back into the atmosphere.  Yet it is considered essentially certain that this will indeed occur. 

Global warming due to continued emissions of greenhouse gases will continue indefinitely unless greenhouse gas emissions are reduced.  If the peoples of the earth succeed in lowering annual emission rates to near zero, further warming will come to an end, and the earth will experience a new, higher global average temperature than we have now.  We must strive to reduce annual emission rates to (near) zero in order to minimize the additional warming of the earth.


Details


The ten hottest years on record occurred between 1998 and the present.  The second hottest years, only slightly less warm on average than 2014, were 2005 and 2010 (see the first graphic above).   The finding that 2014 exceeded all other records is even more significant because it occurred in a year in which the El Nino Southern Oscillation, a warming pattern in the Pacific Ocean, was absent. 

NOAA presents the global map, below, showing deviations in temperature from the reference period 1981-2010 as color-coded shades grading the deviations from the average.


Global grid showing color-coded deviations of the temperature in 2014 from the average temperature over the period 1981-2010.  Red shades represent temperatures warmer than the average, and blue shades represent temperatures cooler than the average.  (Grey regions had no data available.)


The image above is noteworthy, since it shows that there were many regions, both on land and oceanic, recording record warmest average temperatures whereas there was only one region, south of South America, having a record coldest average temperature.  Indeed, most regions of the earth, both land and sea, had temperatures in 2014 higher than the 1981-2010 average.
 
Climate scientists have pointed out in recent publications that heat is accumulating in the oceans and that sooner or later the excess heat will re-emerge, so that the global average air temperature will resume climbing.

Loeb and coworkers (Nature Geoscience, vol. 5, pp. 110–113 (2012) doi:10.1038/ngeo1375) compared the energy imbalance of the Earth system with ocean heat content.   Combining satellite temperature measurements and ocean heat measurements to 1,800 m (5,900 ft) they found “between January 2001 and December 2010, Earth has been steadily accumulating energy at a [significant rate]. We conclude that energy storage is continuing to increase in the sub-surface ocean.”

Guemas and coworkers (Nature Climate Change vol. 3, pp. 649–653 (2013) doi:10.1038/nclimate1863)  examined the current “pause” in global warming.  Using historical ocean temperature data and a coupled ocean-atmosphere climate model, they “attribute the onset of [the “pause”] to an increase in ocean heat uptake.”  They verify that no reduction in the sun’s radiation was found which could explain the “pause”.

Chen and Tung (Science Vol. 345, pp. 897-903 (2014)  DOI: 10.1126/science.1254937) analyzed earlier data as well as more extensive newer observations gathered by buoys disposed worldwide at various ocean depths.  They found that “the [“pause”] is mainly caused by heat transported to deeper layers in the Atlantic and the Southern oceans….Cooling periods associated with the latter deeper heat-sequestration mechanism historically lasted 20 to 35 years.”  They further conclude “because the planetary heat [reservoirs] in the Atlantic and the Southern Oceans remain intact, the [“pause”] should continue on a decadal time scale. When the internal variability that is responsible for the current [“pause”] switches sign, as it inevitably will, another episode of accelerated global warming should ensue.”

© 2015 Henry Auer

Friday, October 17, 2014

Deniers Mistakenly Say that Global Warming Has Ended


Global Average Temperatures and CO2.  The global average temperature has increased by about 0.7-0.8ºC (1.3-1.4ºF) over pre-industrial values.  Humanity’s use of fossil fuels to power industrialization emits carbon dioxide (CO2), a greenhouse gas, leading to warmer average temperatures.  Analysis of the increased CO2 levels shows that they arise directly from burning fossil fuels, and not from natural causes (see also the U. S. National Climate Assessment).

Climate deniers do not accept that our planet is warming, and/or that human activity is its cause.  Climate skeptics may question that human actions are responsible for warming, or that warming is harmful to human populations and other life forms.  Here both groups will be called “deniers”.

Climate deniers claim that global warming has ended.  They selectively display global temperature data for, say, the period 1980 to the present, as shown in this graphic:
 
 
Yearly values of the global average temperature selected for the interval 1980-2013, shown as their difference from the average temperature for the entire 20th century.
Source: Data table from National Aeronautics and Space Administration;
 
 
Other more biased presenters don’t show any data before 1997.  These deniers point to the interval after 1997 as showing that the temperature has remained essentially unchanged (here called the “pause”), breaking with the upward trend from 1980 to 1997.  Since atmospheric CO2 concentrations continued to increase during the pause period (see below), deniers state that increasing atmospheric concentrations of CO2 cannot be the cause for global warming.

 
Deniers  cannot selectively choose the data they wish to use while rejecting the entire data set from consideration.  It is unacceptable to focus arbitrarily on only the period supporting their view while ignoring the extended global temperature record.  Data covering most of the industrial era, 1880-present, are shown below. 
 

Yearly values of the global average temperature for 1880-2013, shown as the differences from the average temperature for the entire 20th century.  Black points and line, annual average temperature differences; Red line, smoothing obtained as a 5-year running window centered at each data point; Green, error bars showing estimates of uncertainty in the measurements.
Source: National Aeronautics and Space Administration.  http://data.giss.nasa.gov/gistemp/graphs_v3/
 
 
The overall trend shows a clear, if uneven, rise in the global average temperature beginning at about 1910, coinciding with increasing atmospheric levels of CO2 (see below and this post).  Importantly, a seemingly long pause also occurred from about 1950-1975, followed by more than 20 years in which the temperature rose sharply.  It is noteworthy that deniers fail to mention this earlier pause as evidence that warming has ceased.
 
A Simple Inert Earth Model.  Deniers are incorrectly assuming that in the Earth system, the only factor affecting the air temperature around the globe is the amount of CO2 in the atmosphere.  Such a simple model, featuring an inert Earth, may be illustrated using the following graphic.  

Model for a simplified inert Earth system close to radiation balance.  It re-emits much of the sun’s energy back into space as heat (infrared) radiation.  In this model only the atmosphere retains excess heat.  © Henry Auer

 
In essence, deniers ignore any additional components in the Earth system that affect the energy balance.

A Complex Earth System Model.  Why is the Earth’s temperature record so erratic?  Why do these pauses occur?  The answer to these questions is that the Earth is not a simple object inert to the effects of the sun’s energy.  Rather, the Earth is a complex system that responds to inputs of excess energy from the sun in many ways.  This can be modeled by a complex Earth system in the image below.
Model of the Earth system, including CO2 in its atmosphere and potential reservoirs of heat in the land, the oceans and the polar ice caps.  This Earth is not in energy equilibrium; less energy is radiated back into space than the energy falling on it from sunlight.  The extra energy heats the entire earth system, with most of the heat being stored in the ocean rather than in the atmosphere. © Henry Auer

 
This more realistic model for Earth is not in energy balance.  Direct satellite measurements of radiation leaving Earth are compared with sunlight energy reaching the Earth.  Because of the greenhouse effect the Earth retains excess heat, rather than re-emitting it back into space.  

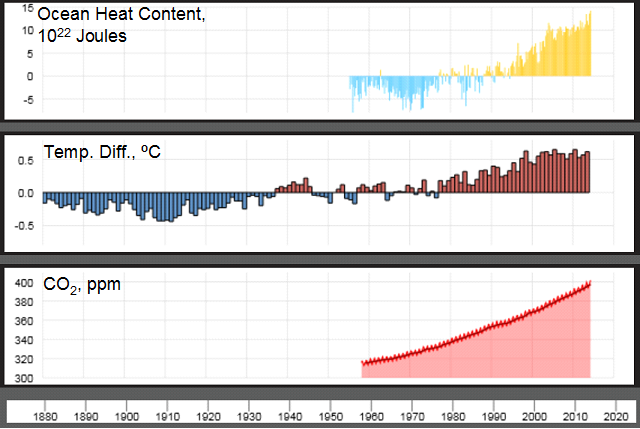
Most of the retained heat is stored in the oceans, and not in the atmosphere.  This is why deniers are mistaken by speaking in terms of an inert Earth model, i.e., in assuming that the temperature in the atmosphere is determined only by the atmospheric CO2 concentration.  This is shown in the following graphic.
 

Top panel: Total heat energy stored in the top half-mile of Earth’s oceans compared to the average from 1955-2006.  Middle panel: Yearly global average temperature compared to the average value for the full 20th century (repeating the pattern shown in the earlier graphic).  Bottom panel: Direct measurement of atmospheric CO2 from 1958 in parts per million (ppm).
Source: National Oceanic and Atmospheric Administration;
 
 
It is seen from the lower panel that the CO2 concentration has been rising steadily since 1958; indeed a smooth curve such as seen here extends back to pre-industrial times, when the concentration was 280 ppm.  The pronounced variability in the temperature data (middle panel) contrasts with the smooth, steady increasing trend seen  for CO2.  This suggests, as indicated above, that factors other than only the atmospheric CO2 concentration are at play. 
 
90% of the excess heat retained in the Earth system is stored in the oceans.  The data in the top panel show that heat energy absorbed by the oceans has been steadily increasing since at least about 1970, including the prior pause of global atmospheric temperature, and has continued to increase even during the current pause.  Instead of ending up warming the atmosphere, excess heat has been absorbed into the oceans, warming them (see the Details section at the end of this post).  Since oceans have decade-long cycles of vertical as well as lateral currents, this heat remains latent in the oceans, but will eventually be transferred back to the atmosphere, renewing the trend of increasing global atmospheric temperature.  
 
Conclusion
 
The long-term global average temperature has increased by about 0.7-0.8ºC over pre-industrial temperatures.  A current pause of annual global temperatures began after 1997 even though the atmospheric concentration of CO2 continued to increase during this period.  Global warming deniers have seized on this pause to say that warming of the Earth has ended, since the air temperature has not responded to the increased CO2 concentration on a year-by-year basis. 
 
In fact direct measurements of the Earth’s energy balance show that it does retain excess heat, but does not store it in the atmosphere.  Rather, the excess heat enters the oceans.  It is stored there as deep as 1,500 m (4,920 ft) in slow-moving ocean currents, both lateral and vertical.  As the warmer water is lifted to the surface again, it will exchange this stored heat with the atmosphere, resuming the warming of the air.  Similar processes happened in an earlier pause event.  Global (atmospheric) warming continues on the extended time scales dictated by Earth system processes.  Global warming deniers are mistaken in saying that global warming has ended.
 
Details
 
Guemas and coworkers (Nature Climate Change vol. 3, pp. 649–653 (2013); doi:10.1038/nclimate1863)  examined the current pause in global warming.  They used earlier data as a baseline to project sea surface temperatures forward up to 2010 using a coupled ocean-atmosphere climate model.  From their results they “attribute the onset of [the pause] to an increase in ocean heat uptake.”  They verify that no reduction in the sun’s radiation can explain the pause.
 
Loeb and coworkers (Nature Geoscience, vol. 5, pp. 110–113 (2012); doi:10.1038/ngeo1375) compared the energy imbalance of the Earth system with ocean heat content.  They measured radiated heat energy and sea temperatures.  They found that the energy imbalance of the Earth system and the increase in the upper-ocean heat content are similar in magnitude.  Combining satellite temperature measurements and ocean heat measurements to 1,800 m (5,900 ft) they found “between January 2001 and December 2010, Earth has been steadily accumulating energy at a [significant rate]. We conclude that energy storage is continuing to increase in the sub-surface ocean.”
 
Chen and Tung (Science Vol. 345, pp. 897-903 (2014)  DOI: 10.1126/science.1254937) analyzed earlier data as well as more extensive newer observations gathered by buoys disposed worldwide at various ocean depths.  They found that “the [pause] is mainly caused by heat transported to deeper layers in the Atlantic and the Southern oceans….Cooling periods associated with the latter deeper heat-sequestration mechanism historically lasted 20 to 35 years.”  They further conclude “because the planetary heat [reservoirs] in the Atlantic and the Southern Oceans remain intact, the [pause] should continue on a decadal time scale. When the internal variability that is responsible for the current [pause] switches sign, as it inevitably will, another episode of accelerated global warming should ensue.”
 
© 2014 Henry Auer


Sunday, May 4, 2014

How Sea Level Rises: A Tutorial


Summary.  Among the documented effects of global warming has been a rise of the average sea level around the globe since 1900.  This post explains, in tutorial fashion, how this happens.

First, the water in the oceans expands in volume as its temperature increases.  Expansion is constrained to occur only in the upward direction, leading to sea level rise.  Second, land-based glaciers and ice sheets melt from their upper surfaces as the air they contact warms above the melting point of water.  Third, ice shelves buoyed by the ocean in Antarctica melt from their lower surfaces as the ocean circulating under them warms.  All these processes contribute to observed sea level rise.  Both melting processes are expected to continue indefinitely as long as warming produces temperatures in the air and in the underlying ocean that remain above the melting point.
 

Introduction.  One of the consequences of global warming identified by climate scientists is sea level rise.  Higher levels of the oceans’ waters potentially affect shorelines and low-lying islands all around the world.

The United Nations-sponsored Intergovernmental Panel on Climate Change (IPCC), in its Fifth Assessment Report (5AR), includes the following graphic showing the extent to which the global average sea level has risen in past decades up to the present.

Global average sea level change from 1900 to the present.  Each color presents a different data set.  The red line gives satellite measurements beginning in 1993.  Shadings, when present, characterize statistical variability in the data. mm, millimeters.

 
The graphic shows that since 1900 global average sea level has risen by about 200 millimeters (about 7.9 in.).  It is expected to continue rising indefinitely into the future (see below).

This post describes two main factors contributing to rising sea level, expansion due to heating and melting.

Expansion of water upon heating.  Like all forms of matter, water expands when it is heated and contracts when it is cooled.  At a temperature of 20ºC (68ºF) water expands by a factor of about 0.00020 per ºC (0.00011 per ºF).  We may think that the expansion occurs in all directions, as if the water of the ocean were in an elastic balloon.  This would have the effect of minimizing expansion in the vertical direction.  But in fact, the waters of the oceans are constrained on the bottom by the ocean floor and on the sides by shorelines, so that all the expansion occurs only upwards. 

Oceanographers have been measuring temperature changes in the ocean by depth, and find that the ocean temperature has increased in the last several decades down to depths of several hundred meters (see below).  For the sake of this discussion, if the temperature increased on average from 20ºC to 21ºC down to a depth of 700 meters (2,275 feet; defined as the “upper ocean”) expansion would cause the surface of the water to rise by 140 mm, or 5.6 in.  This simple calculation shows that an increase in surface temperature of the ocean is a contributing factor for sea level rise.

Melting of land-based ice.  Some sea ice arises by freezing of the ocean water.  This process transfers some water from liquid to solid, say as the polar winter arrives, which then melts back to the liquid during the polar summer.  Such cyclical changes in state have no net effect on sea level.

Transfer of land-based ice to the oceans, however, a one-time process, represents a net addition of water to the sea, raising its level.  The new water was not part of the ocean system before melting.   There are several sources of new ocean water.  Mountain glaciers at high elevations are melting around the world as a result of global warming.  The water courses through streams and rivers, and ultimately reaches the sea. 

Ice sheets over land masses, such as the Greenland ice sheet, melt from their upper surfaces when the air is above the freezing point.  This water penetrates gaps in the ice sheets and finds its way to the ocean.  Additionally, land mass glaciers at the interface with the sea calve icebergs as the glacier flows downhill toward the sea.  The solid ice in the icebergs and the water that it gives rise to as it melts contribute to raising the sea level.

This process can be diagrammed using the following simplified graphic:

Ice cube model for melting glaciers and ice sheets.  The ice cube melts at exactly 0ºC.  Ice cube image from www.dreamstime.com.

 
At the left in the diagram, the air temperature is below the melting point of the ice cube, so it stays solid and does not lose any mass.  The second frame shows the case for the air temperature being exactly 0ºC.  Under these conditions solid ice and liquid water, shown as the tiny white puddle at the base of the ice cube, are in equilibrium with each other.  Again the ice cube essentially remains unchanged, losing no mass. 

In the third frame the air temperature is 1ºC (33.8ºF).  Ice melts because heat contained in the air is transferred to the solid ice, providing the energy needed to melt it (see here  for further explanation of this notion).  The ice cube melts relatively slowly at this moderate air temperature, creating the small water puddle around its base and making the ice cube slightly smaller.  The ice cube will continue to melt slowly as long as the air temperature stays about 1ºC.

The fourth frame shows the case in which the air temperature is 2ºC (35.6ºF).  The ice cube melts more rapidly, because the rate of heat transfer from the air to the ice is higher.  Now the water puddle is quite large, and the ice cube has shrunk considerably in size.  The ice cube will continue to melt rapidly as long as the air temperature remains about 2ºC. 

The ice cube model can be taken to represent the melting of high-altitude mountain glaciers, land-mass ice sheets such as the Greenland ice sheet, and, indirectly, the calving of icebergs from glaciers moving into the sea; the latter movement is accelerated by global warming.  In addition some glaciers that were earlier in contact with the ocean have melted so fast that their leading edges have receded from the ocean and are now found at some considerable distances from the shoreline.

Melting of Antarctic Ice Shelves.  Ice shelves, such as are found in Antarctica, are large areas of ice that are the oceanic ends of land-based ice sheets that flow over the ocean and float on its surface.  Ice shelves are distinguished from ice sheets by the fact that they cover ocean water, rather than land.  An ice shelf is diagrammed in the graphic below:
 

                            Simplified model of an ice shelf extending over the ocean.

 
An ice shelf does not primarily melt from the upper surface.  The Antarctic region is sufficiently cold that surface melting does not occur to a significant extent.  Rather the ice shelf melts from below, by contacting the liquid ocean, whenever the water temperature is above the equilibrium melting temperature of the ocean, about -2°C (28.4°F; this lower melting point is due to the dissolved salts present in ocean water).

Melting of the ice shelf eats away at its substance from its lower surface, as shown in the following graphic:
 
Mechanism of melting of an Antarctic ice shelf from its lower surface.  Warm ocean water flows toward the shore over the ocean floor (orange arrows).  It transfers its heat to the undersurface of the ice shelf, melting it.  The water containing the melted ice remains near the upper surface because, having a lower salt content, it is less dense than the ocean water flowing in.  This newly-melted water flows back toward the bulk ocean (orange arrows).

 
The result of this melting process is to add water substance to the ocean that was not present before, raising the level of the ocean.  In addition, the ice shelf thins and recedes as melting proceeds, including breaking off of ice floes that will continue to melt.  The rate of melting gets greater as the ocean temperature becomes increasingly warmer than the melting point of ocean water. 

Ocean warming is in fact happening.  5AR estimates  that 90% of the excess heat arising from global warming is stored in the oceans.  The historical trend of the total amount of heat contained in the oceans has been rising from 1950 (the time when these measurements began) to 2010, as shown in the graphic below:

Change in the global mean upper ocean (0–700 m) heat content in joules (a unit of energy) from 1950 to 2010.  The data in different colors come from different data sets, and the shadings in the same colors represent estimates of statistical variability for the given data set.  The values along the vertical axis show the changes from a zero point assigned relative to the mean of all datasets for 1971, and have been computationally adjusted to overlap for the period 2006-2010.
 
As the heat content increases the ice shelf will melt more rapidly and more extensively.  Climate scientists expect the global ocean heat content to continue increasing, so that ice shelf melting will continue indefinitely.  As noted above, ice shelf melting can only stop if the ocean temperature remains at or below the ocean melting point for ice. 
 
Conclusion
 
There are two processes contributing to rising sea levels due to global warming, expansion of the volume of water contained in the oceans and net melting of ice mass to become liquid water.
 
Thermal expansion is a natural property of water and other liquids.  As water warms it occupies more volume.  This expansion probably occurs for several hundred meters of depth, raising the level of the surface of the ocean. 
 
Melting of glaciers and land-based ice sheets occurs primarily from their upper surfaces, as heat is transferred from the air to the ice solid, liquefying it.  Antarctic ice shelves, on the other hand, melt from below due to contact with ocean water whose temperature is above the ocean’s freezing point.  In both cases, the rate of melting increases as the temperature of the air, or the liquid ocean, respectively, becomes warmer.  Melting increases the total volume of the earth’s oceans, leading to a rise in the global average sea level.
 
Thermal expansion will cease if and when the global average temperature stops increasing, reaching a new, higher plateau value.  Enhanced melting of ice mass will continue indefinitely, however, as long as the global average temperature remains above the freezing point of ice or of ocean water.  Unfortunately, since carbon dioxide, the principal greenhouse gas, remains in the atmosphere for several centuries, even achieving near-zero annual rates of emission will only stabilize the global average temperature at some new, higher value; with current technology carbon dioxide cannot be removed from the atmosphere.  This means the average temperature of the atmosphere and of the oceans will not fall, and will likely continue to rise.  For this reason land-based ice sheets and Antarctic ice shelves will continue melting indefinitely for generations to come.  The effects on ocean shorelines around the world will be considerable and essentially permanent.
 
 
© 2014 Henry Auer