Global
Average Temperatures and CO2. The global average
temperature has increased by about 0.7-0.8ºC (1.3-1.4ºF) over pre-industrial values. Humanity’s use of fossil fuels to power industrialization
emits carbon dioxide (CO2), a greenhouse gas, leading to warmer
average temperatures. Analysis of the
increased CO2 levels shows that they arise directly from burning fossil fuels, and not from
natural causes (see also the U. S. National Climate Assessment).
Climate deniers do not accept that our planet is warming, and/or
that human activity is its cause.
Climate skeptics may question that human actions are responsible for warming,
or that warming is harmful to human populations and other life forms. Here both groups will be called “deniers”.
Climate deniers claim
that global warming has ended. They selectively display global temperature
data for, say, the period 1980 to the present, as shown in this graphic:

Yearly values of
the global average temperature selected for the interval 1980-2013, shown as their
difference from the average temperature for the entire 20th century.
Source: Data table
from National Aeronautics and Space Administration;
Other more biased
presenters
don’t show any data before 1997.
These deniers point to the interval after 1997 as showing that the
temperature has remained essentially unchanged (here called the “pause”),
breaking with the upward trend from 1980 to 1997. Since atmospheric CO2
concentrations continued to increase during the pause period (see below), deniers
state that increasing atmospheric concentrations of CO2 cannot be
the cause for global warming.
Deniers cannot selectively choose the data they wish
to use while rejecting the entire data set from consideration. It
is unacceptable to focus arbitrarily on only the period supporting their view
while ignoring the extended global temperature record. Data covering most of the industrial era,
1880-present, are shown below.

Yearly values of
the global average temperature for 1880-2013, shown as the differences from the
average temperature for the entire 20th century. Black points and line, annual average
temperature differences; Red line, smoothing
obtained as a 5-year running window centered at each data point; Green, error bars showing estimates of uncertainty
in the measurements.
Source: National
Aeronautics and Space Administration. http://data.giss.nasa.gov/gistemp/graphs_v3/
A Simple Inert
Earth Model. Deniers are incorrectly assuming that in the
Earth system, the only factor affecting the air temperature around the globe is
the amount of CO2 in the atmosphere.
Such a simple model, featuring an inert Earth, may be illustrated using
the following graphic.

A Complex Earth
System Model. Why is the Earth’s temperature record so
erratic? Why do these pauses occur? The answer to these questions is that the
Earth is not a simple object inert to the effects of the sun’s energy. Rather, the Earth is a complex system that
responds to inputs of excess energy from the sun in many ways. This can be modeled by a complex Earth system
in the image below.
 Model of the Earth
system, including CO2 in its atmosphere and potential reservoirs of
heat in the land, the oceans and the polar ice caps. This Earth is not in energy equilibrium; less
energy is radiated back into space than the energy falling on it from
sunlight. The extra energy heats the
entire earth system, with most of the heat being stored in the ocean rather
than in the atmosphere. © Henry Auer
Model of the Earth
system, including CO2 in its atmosphere and potential reservoirs of
heat in the land, the oceans and the polar ice caps. This Earth is not in energy equilibrium; less
energy is radiated back into space than the energy falling on it from
sunlight. The extra energy heats the
entire earth system, with most of the heat being stored in the ocean rather
than in the atmosphere. © Henry Auer
Most of the retained
heat is stored in the oceans,
and not in the atmosphere. This is why
deniers are mistaken by speaking in terms of an inert Earth model, i.e., in
assuming that the temperature in the atmosphere is determined only by the
atmospheric CO2 concentration.
This is shown in the following graphic.
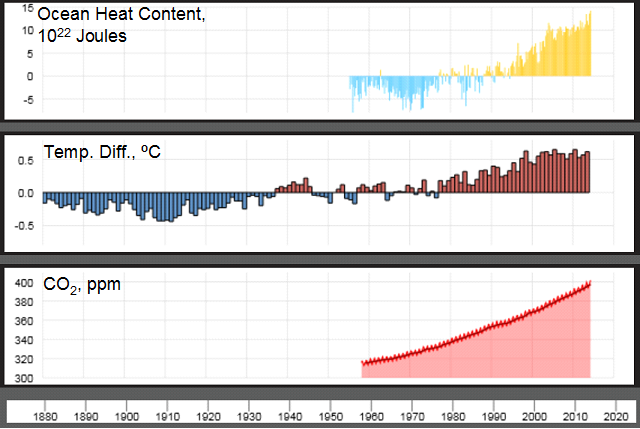
Top panel: Total
heat energy stored in the top half-mile of Earth’s oceans compared to the
average from 1955-2006. Middle panel:
Yearly global average temperature compared to the average value for the full 20th
century (repeating the pattern shown in the earlier graphic). Bottom panel: Direct measurement of
atmospheric CO2 from 1958 in parts per million (ppm).
Source:
National Oceanic and Atmospheric Administration;
It is seen from the
lower panel that the CO2 concentration has been rising steadily
since 1958; indeed a smooth curve such as seen here extends back to
pre-industrial times, when the concentration was 280 ppm. The pronounced variability in the temperature
data (middle panel) contrasts with the smooth, steady increasing trend
seen for CO2. This suggests, as indicated above, that
factors other than only the atmospheric CO2 concentration are at
play.
90% of the
excess heat retained in the Earth system is stored in the oceans. The
data in the top panel show that heat energy absorbed by the oceans has been
steadily increasing since at least about 1970, including the prior pause of
global atmospheric temperature, and has continued to increase even during the
current pause. Instead of ending up
warming the atmosphere, excess heat has been absorbed into the oceans, warming
them (see the Details section at the end of this post). Since oceans have decade-long cycles of
vertical as well as lateral currents, this heat remains latent in the oceans,
but will eventually be transferred back to the atmosphere, renewing the trend
of increasing global atmospheric temperature.
Conclusion
The long-term
global average temperature has increased by about 0.7-0.8ºC over pre-industrial
temperatures. A current pause of annual
global temperatures began after 1997 even though the atmospheric concentration
of CO2 continued to increase during this period. Global warming deniers have seized on this pause
to say that warming of the Earth has ended, since the air temperature has not
responded to the increased CO2 concentration on a year-by-year
basis.
In fact direct
measurements of the Earth’s energy balance show that it does retain excess
heat, but does not store it in the atmosphere.
Rather, the excess heat enters the oceans. It is stored there as deep as 1,500 m (4,920
ft) in slow-moving ocean currents, both lateral and vertical. As the warmer water is lifted to the surface
again, it will exchange this stored heat with the atmosphere, resuming the warming
of the air. Similar processes happened
in an earlier pause event. Global
(atmospheric) warming continues on the extended time scales dictated by Earth
system processes. Global warming deniers
are mistaken in saying that global warming has ended.
Details
Guemas and
coworkers (Nature Climate Change vol. 3, pp. 649–653 (2013); doi:10.1038/nclimate1863)
examined the current pause in global
warming. They used earlier data as a
baseline to project sea surface temperatures forward up to 2010 using a coupled
ocean-atmosphere climate model. From
their results they “attribute the onset of [the pause] to an increase in ocean
heat uptake.” They verify that no
reduction in the sun’s radiation can explain the pause.
Loeb and
coworkers (Nature Geoscience, vol. 5, pp. 110–113 (2012); doi:10.1038/ngeo1375)
compared the energy imbalance of the Earth system with ocean heat content. They measured radiated heat energy and sea
temperatures. They found that the energy
imbalance of the Earth system and the increase in the upper-ocean heat content
are similar in magnitude. Combining
satellite temperature measurements and ocean heat measurements to 1,800 m
(5,900 ft) they found “between January 2001 and December 2010, Earth has been
steadily accumulating energy at a [significant rate]. We conclude that energy
storage is continuing to increase in the sub-surface ocean.”
Chen and Tung (Science Vol. 345, pp. 897-903 (2014) DOI: 10.1126/science.1254937)
analyzed earlier data as well as more extensive newer observations gathered by
buoys disposed worldwide at various ocean depths. They found that “the [pause] is mainly caused
by heat transported to deeper layers in the Atlantic and the Southern oceans….Cooling periods
associated with the latter deeper heat-sequestration mechanism historically
lasted 20 to 35 years.” They further
conclude “because the planetary heat [reservoirs] in the Atlantic and the Southern Oceans remain intact, the [pause]
should continue on a decadal time scale. When the internal variability that is
responsible for the current [pause] switches sign, as it inevitably will,
another episode of accelerated global warming should ensue.”
© 2014 Henry Auer
This is such a purposefully mendacious piece I laughed out loud at it.
ReplyDeleteEspecially the part where you assert:
"Deniers cannot selectively choose the data they wish to use while rejecting the entire data set from consideration. It is unacceptable to focus arbitrarily on only the period supporting their view while ignoring the extended global temperature record."
In truth it is the skeptics, not the alarmists, who most certainly consider, study and regularly mention the entire record as well as the contrast between the raw temperature data and the stepped on stuff alarmists peddle.
No wonder you have no comments.
I regret that the commenter “Anonymous” doesn’t have the integrity to identify her/himself, especially since s/he abandons respect for her/his adversaries and calls this post “purposefully mendacious”.
DeleteOf course nothing is further from the truth. I invite Anonymous to examine the post http://wattsupwiththat.com/2014/10/01/happy-anniversary-1-october-marks-18-years-without-global-warming-trend/, cited in my post, as a prime example wherein a skeptic selects only the period from 1997 onward. The skeptic fails to consider the full temperature record from 1880 as has been done in the present post. Anonymous also does not address the scientific evidence concerning the buildup of ocean heat content presented in this post.